The COVID-19 pandemic is a challenge that is ultimately solved by our ability to curate, publish, and share data openly using key principles such as:
- Open Data – where structured data is published to the Web using open standard formats
- Linked Data – where hyperlinks are used to enhance published Open Data by functioning as unambiguous identifiers for entities, entity types, and entity relationship types.

Adhering to the principles above reduce the amount of Data Wrangling overhead encountered by subject-matter experts, researchers, government departments, medical professionals, and many others that are on the frontlines of this global pandemic. Here are examples of exemplary Open Data publishers that I’ve stumbled upon recently.
Our World In Data – daily tracking covering outbreaks and testing.

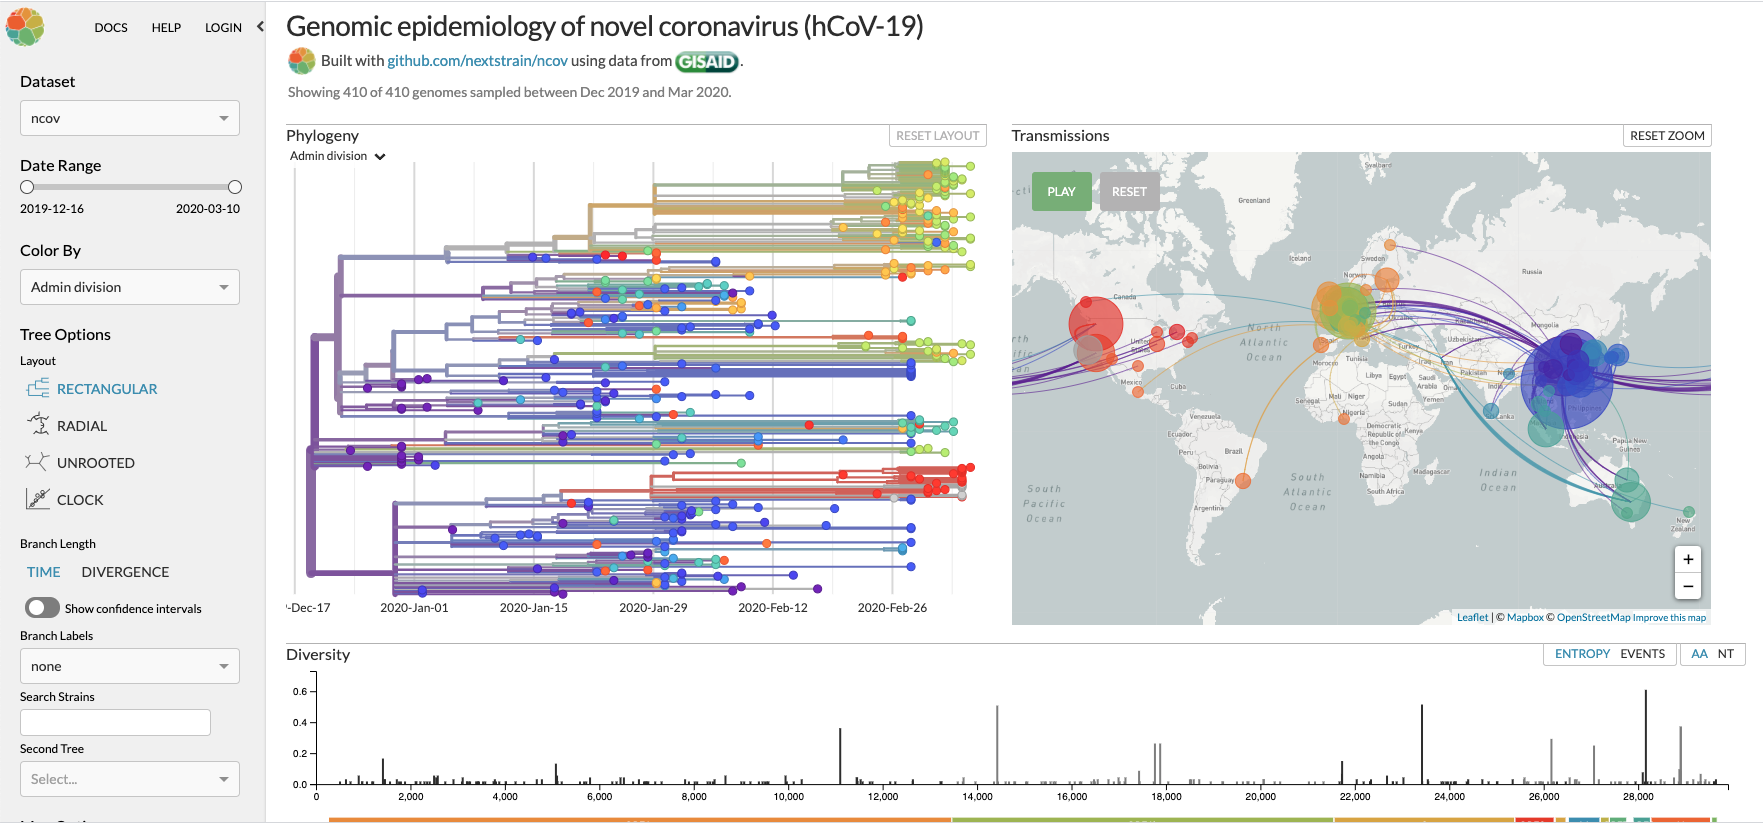
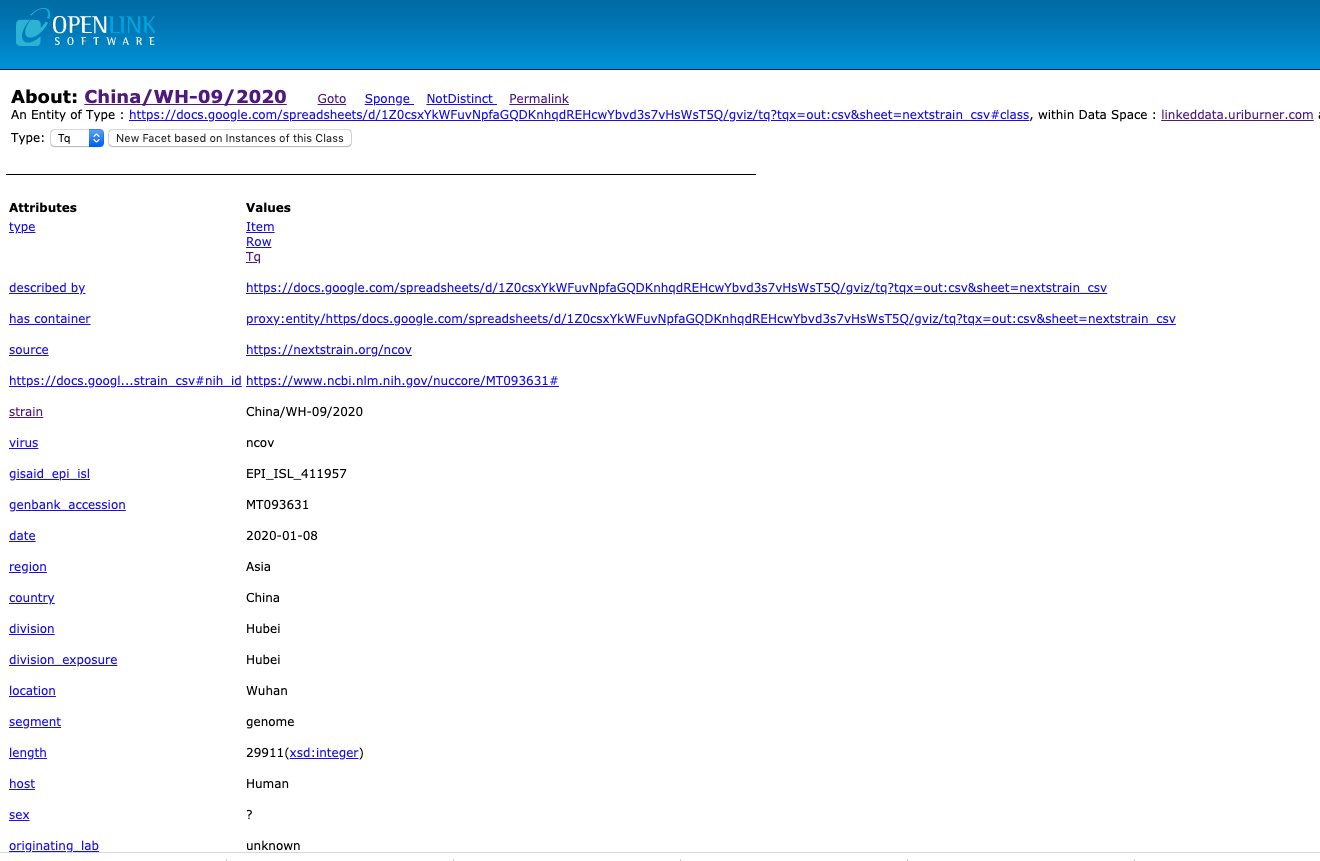
Nextstrain – publishes information about SARS_COV-2 virus specimens submissions.
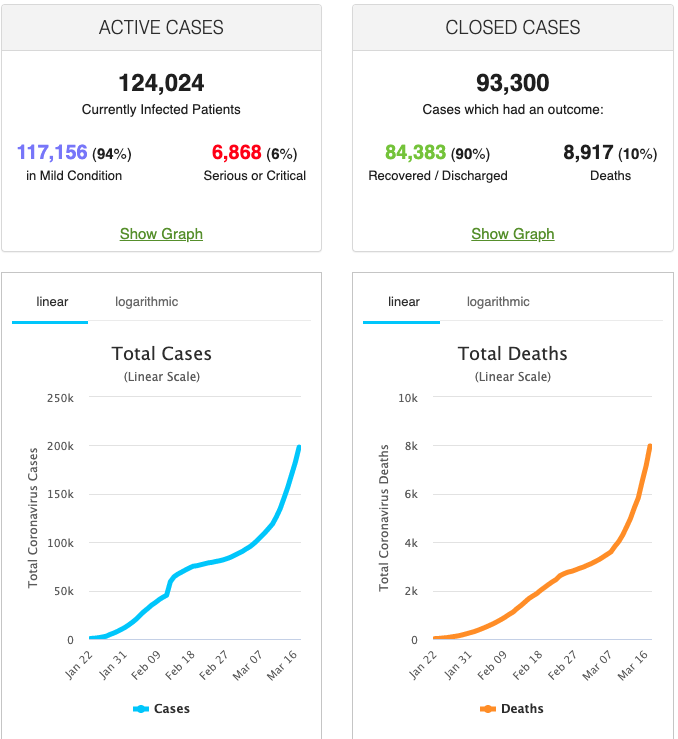
Worldometers – tracking that covers outbreak related information.
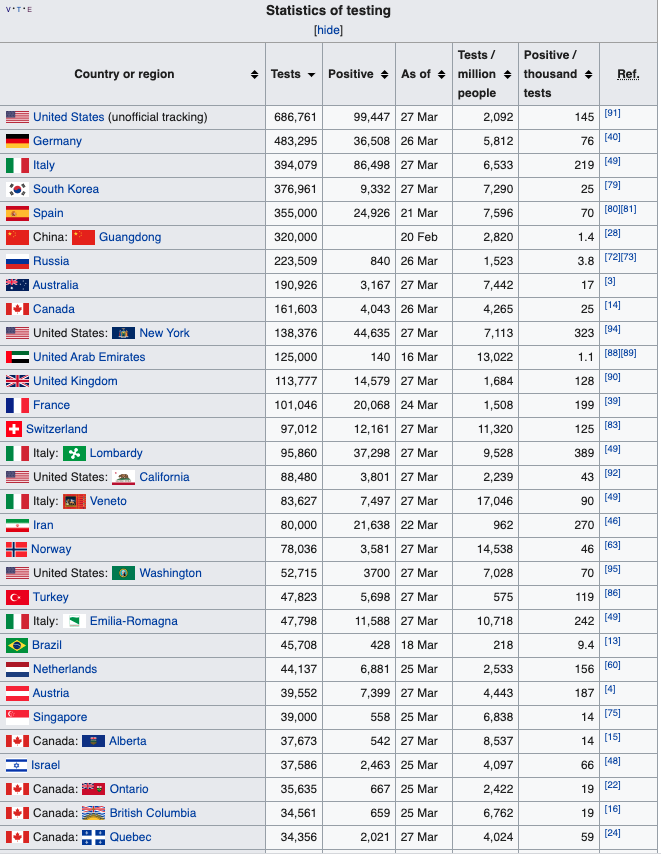
Wikipedia COVID-19 Testing By Country Table
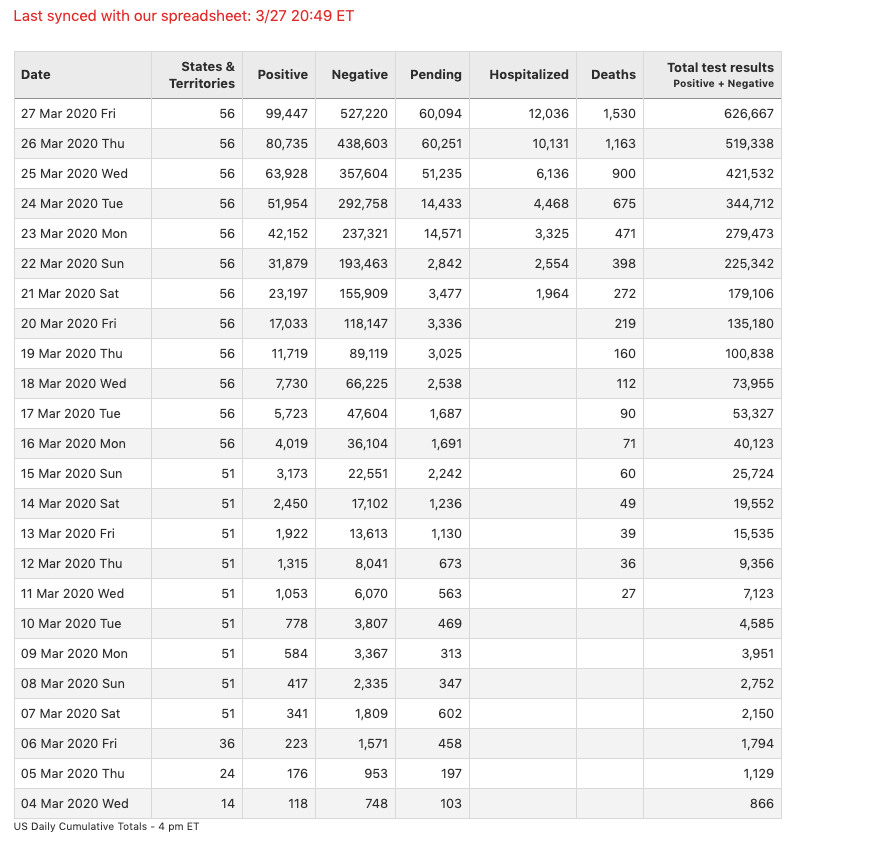
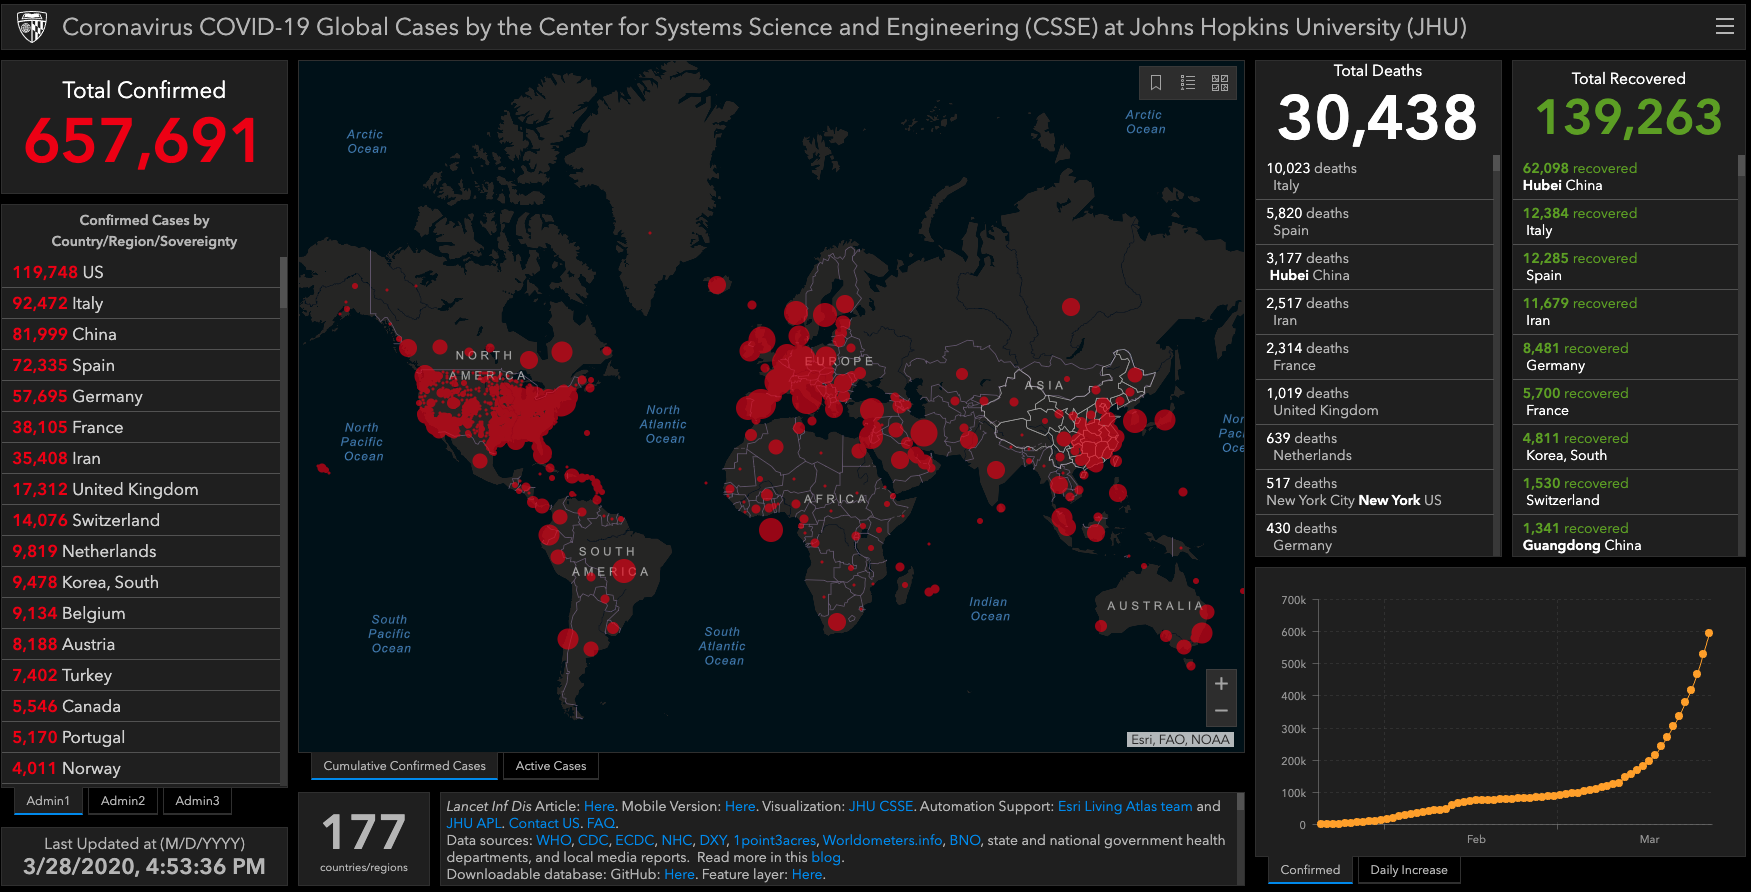
Johns Hopkins COVID19 Tracking Project
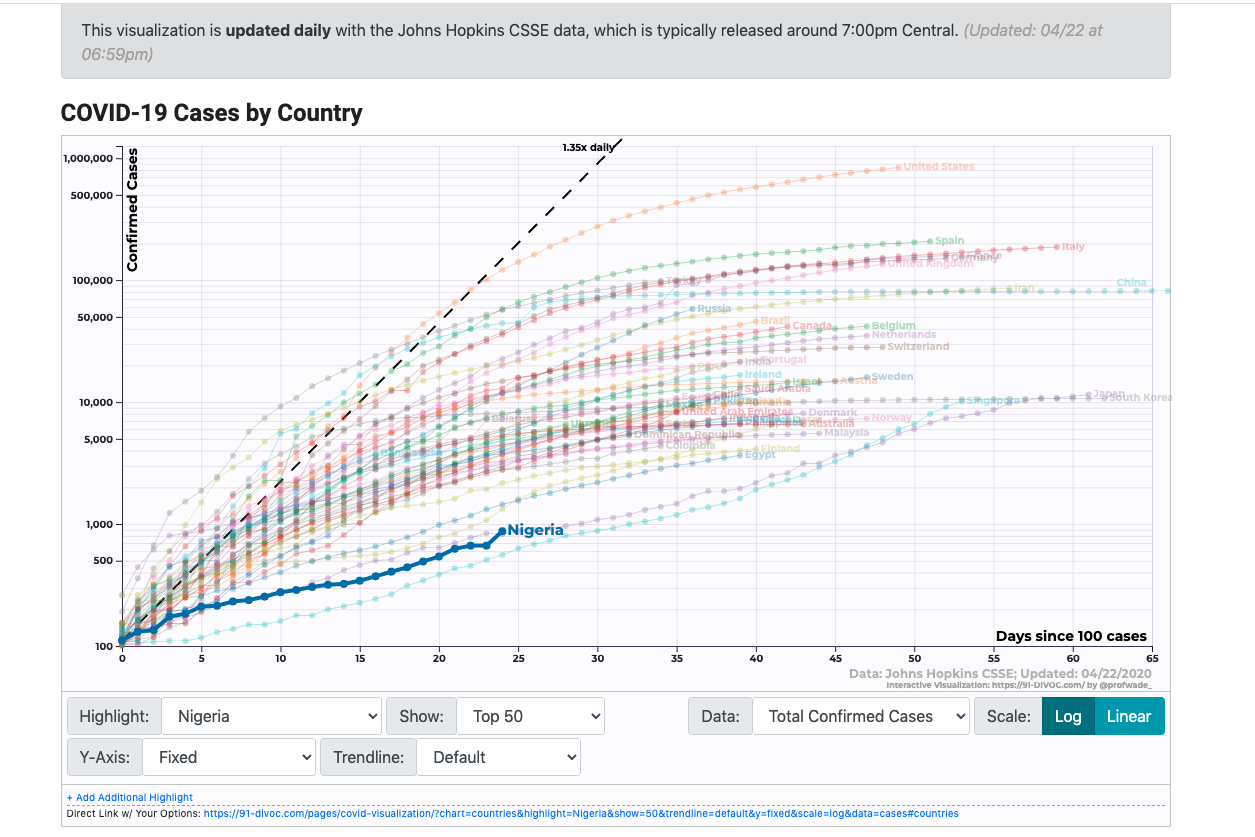
91-DIVOC – by Prof. Wade Fagen-Ulmschneider
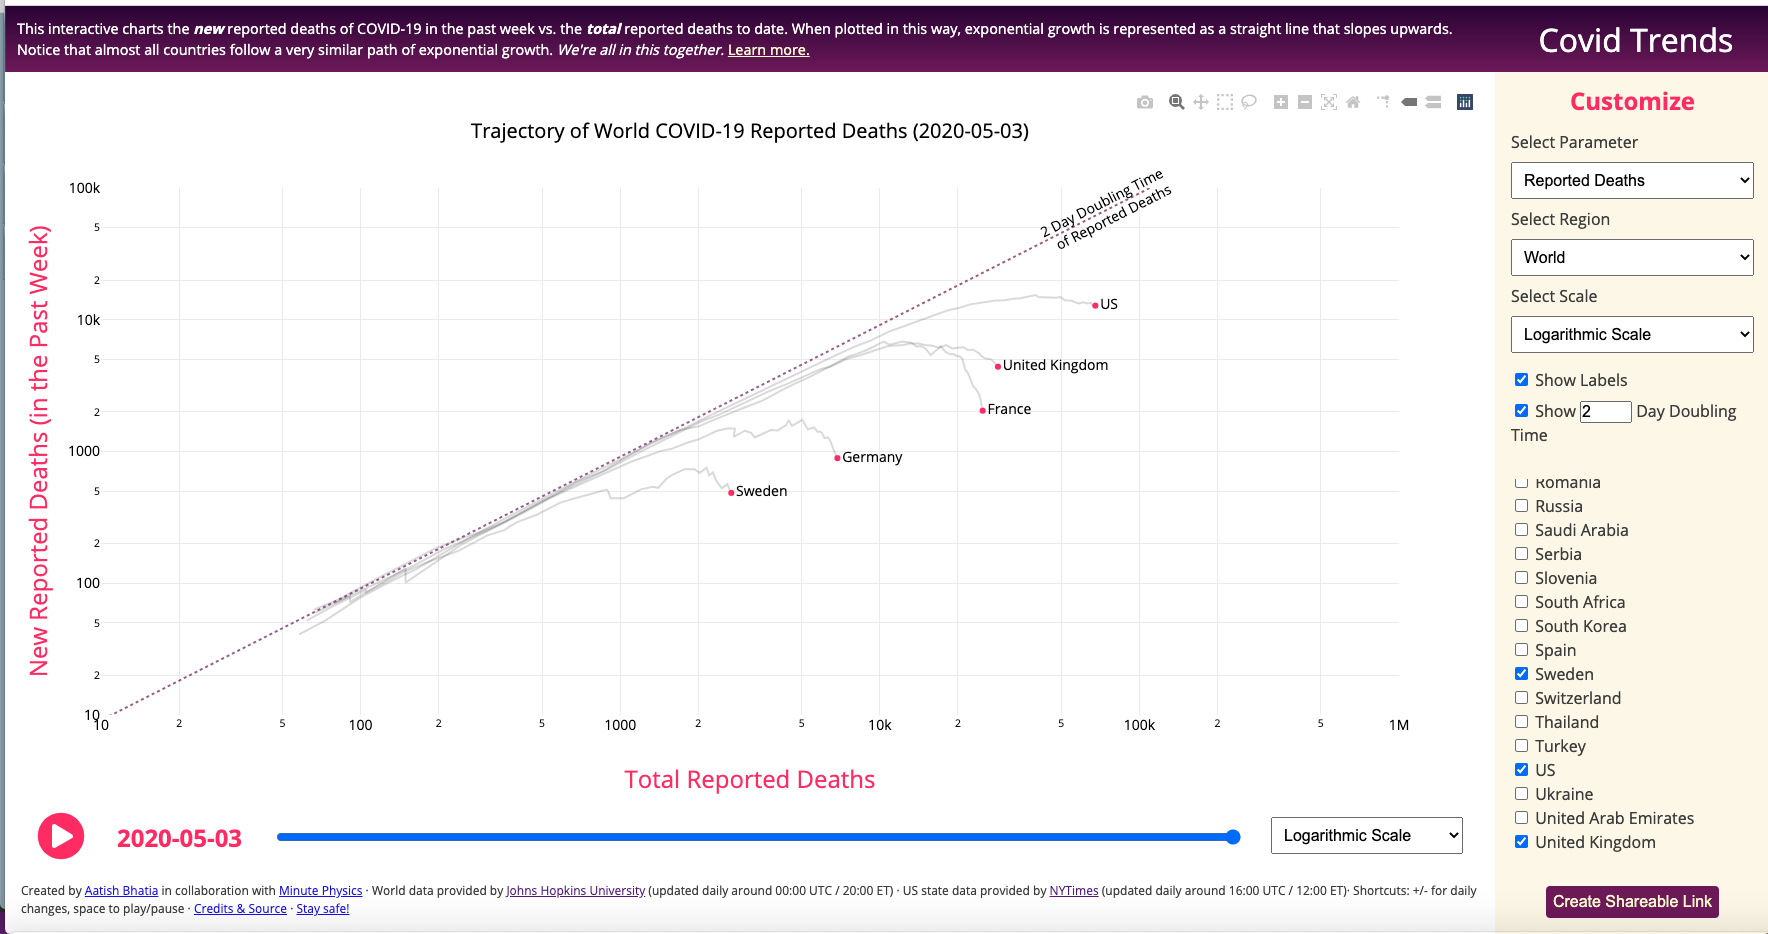
COVID-19 Trends – by Aatish Bhatia
On our part, we see a need to progressively mesh new COVID-19 and SARS_COV-2 virus information with the rich collective that already exists in the massive LOD Cloud Knowledge Graph.
Here’s a breakdown of how I’ve approached this task by leveraging the productivity features of a spreadsheet for operating on Tables en route to generating 5-Star Linked Open Data that provides different routes into the LOD Cloud via DBpedia and/or Wikidata.
Google Spreadsheet Tabular Data Sources
- https://docs.google.com/spreadsheets/d/1Z0csxYkWFuvNpfaGQDKnhqdREHcwYbvd3s7vHsWsT5Q/gviz/tq?tqx=out:csv&range=A1:H8801&sheet=Consolidated – Consolidated Spreadsheet
- https://docs.google.com/spreadsheets/d/1Z0csxYkWFuvNpfaGQDKnhqdREHcwYbvd3s7vHsWsT5Q/gviz/tq?tqx=out:csv&sheet=Testing_By_Country2 – Testing_By_Country2 Spreadsheet
- https://docs.google.com/spreadsheets/d/1Z0csxYkWFuvNpfaGQDKnhqdREHcwYbvd3s7vHsWsT5Q/gviz/tq?tqx=out:csv&sheet=nextstrain – Nextstrain Spreadsheet (via SPARQL Query that returns CSV)
- https://docs.google.com/spreadsheets/d/1Z0csxYkWFuvNpfaGQDKnhqdREHcwYbvd3s7vHsWsT5Q/gviz/tq?tqx=out:csv&sheet=nextstrain_csv – Nextstrain_csv Spreadsheet (direct CSV import using importData())
- https://docs.google.com/spreadsheets/d/1Z0csxYkWFuvNpfaGQDKnhqdREHcwYbvd3s7vHsWsT5Q/gviz/tq?tqx=out:csv&sheet=SARS_COV_2_Ancestry – SARS_COV_2 Ancestry Spreadsheet that cross-references NCBI Accessions Identifiers with those from Nextstrain
- https://docs.google.com/spreadsheets/d/1Z0csxYkWFuvNpfaGQDKnhqdREHcwYbvd3s7vHsWsT5Q/gviz/tq?tqx=out:csv&sheet=worldometers&range=A3:K168 – Worldometers Range within Spreadsheet
- https://docs.google.com/spreadsheets/d/1Z0csxYkWFuvNpfaGQDKnhqdREHcwYbvd3s7vHsWsT5Q/gviz/tq?tqx=out:csv&range=A1:I95&sheet=Wikipedia_Testing_By_Country – Wikipedia_Testing_By_Country Spreadsheet
- https://docs.google.com/spreadsheets/d/1Z0csxYkWFuvNpfaGQDKnhqdREHcwYbvd3s7vHsWsT5Q/gviz/tq?tqx=out:csv&sheet=US_State_Tracker_To_Date – US_State_Tracker_To_Date Spreadsheet
- https://docs.google.com/spreadsheets/d/1Z0csxYkWFuvNpfaGQDKnhqdREHcwYbvd3s7vHsWsT5Q/gviz/tq?tqx=out:csv&sheet=US_State_Tracker_Daily – US_State_Tracker_Daily Spreadsheet
- https://docs.google.com/spreadsheets/d/1Z0csxYkWFuvNpfaGQDKnhqdREHcwYbvd3s7vHsWsT5Q/gviz/tq?tqx=out:csv&sheet=DBpedia_Country_ISO_Code_Mappings – DBpedia_Country_ISO_Code_Mappings Spreadsheet
- https://docs.google.com/spreadsheets/d/1Z0csxYkWFuvNpfaGQDKnhqdREHcwYbvd3s7vHsWsT5Q/gviz/tq?tqx=out:csv&range=A1:N2486&sheet=latest_daily_report – johns_hopkins_latest_daily_report Spreadsheet (a daily sample since we are also building a mapping from all the daily files to a single relational table that will be mapped to RDF Views)
- https://docs.google.com/spreadsheets/d/1Z0csxYkWFuvNpfaGQDKnhqdREHcwYbvd3s7vHsWsT5Q/gviz/tq?tqx=out:csv&range=A1:I3143&sheet=Kaiser_ICUs_By_US_County – Kaiser_ICUs_By_US_County Spreadsheet
- https://docs.google.com/spreadsheets/d/1Z0csxYkWFuvNpfaGQDKnhqdREHcwYbvd3s7vHsWsT5Q/gviz/tq?tqx=out:csv&range=A3:L55&sheet=us_adults_at_risk_for_corona_complications – us_adults_at_risk_for_corona_complications Spreadsheet
- https://docs.google.com/spreadsheets/d/1Z0csxYkWFuvNpfaGQDKnhqdREHcwYbvd3s7vHsWsT5Q/gviz/tq?tqx=out:csv&range=A1:Z2341&sheet=US_State_Tracker_Daily – US_State_Tracker_Daily Spreadsheet
As you can see from the examples above, you have the local reference capability of a spreadsheet (e.g., the cells in a range) forming a relation stored in a document (the spreadsheet) identified by a hyperlink. Basically, we now have the power of Structured Data representation enhanced by the dual reference and access power of a hyperlink i.e., your Relational Table isn’t confined to a specific DBMS platform.
Interacting with Google Spreadsheet Data using SQL
As part of its URL-patterns collection for REST-ful interaction, you can use the “tq” parameter to provide an encoded SQL Query String for additional relational operations.
Basic Example:
You can apply the query:
SELECT A, B,C,L,M,N
to the spreadsheet identified by
https://docs.google.com/spreadsheets/d/1Z0csxYkWFuvNpfaGQDKnhqdREHcwYbvd3s7vHsWsT5Q/gviz/tq?tqx=out:csv&sheet=US_State_Tracker_To_Date
using the URL
https://docs.google.com/spreadsheets/d/1Z0csxYkWFuvNpfaGQDKnhqdREHcwYbvd3s7vHsWsT5Q/gviz/tq?tqx=out:csv&sheet=US_State_Tracker_To_Date&tq=select%20A%2C%20B%2CC%2CL%2CM%2CN
which you can also invoke via cURL as per the following example.
curl -I "https://docs.google.com/spreadsheets/d/1Z0csxYkWFuvNpfaGQDKnhqdREHcwYbvd3s7vHsWsT5Q/gviz/tq?tqx=out:csv&sheet=US_State_Tracker_To_Date&tq=select%20A%2C%20B%2CC%2CL%2CM%2CN"
More Challenging Example
Imagine a situation where you have data of interest in a specific named-range within a spreadsheet, and you want to retrieve the data in CSV format while excluding a specific row e.g., a row that contains the value “Overall”.

You apply the query
SELECT A, B, C, D, F,G,H,J,K,L WHERE A <> "Overall"
to the Spreadsheet Range identified by
https://docs.google.com/spreadsheets/d/1Z0csxYkWFuvNpfaGQDKnhqdREHcwYbvd3s7vHsWsT5Q/gviz/tq?tqx=out:csv&range=A3:L55&sheet=us_adults_at_risk_for_corona_complications
using the Spreadsheet with an encoded SQL Query
https://docs.google.com/spreadsheets/d/1Z0csxYkWFuvNpfaGQDKnhqdREHcwYbvd3s7vHsWsT5Q/gviz/tq?tq=select%20A%2C%20B%2C%20C%2C%20D%2C%20F%2CG%2CH%2CJ%2CK%2CL%20where%20A%20%3C%3E%20%22Overall%22&tqx=out:csv&range=A3:L55&sheet=us_adults_at_risk_for_corona_complications
which you can also invoke from your command-line using cURL
curl -i "https://docs.google.com/spreadsheets/d/1Z0csxYkWFuvNpfaGQDKnhqdREHcwYbvd3s7vHsWsT5Q/gviz/tq?tq=select%20A%2C%20B%2C%20C%2C%20D%2C%20F%2CG%2CH%2CJ%2CK%2CL%20where%20A%20%3C%3E%20%22Overall%22&tqx=out:csv&range=A3:L55&sheet=us_adults_at_risk_for_corona_complications"
DBpedia Identifiers Incorporation into Spreadsheets
As the kernel that enabled and bootstrapped the LOD Cloud Knowledge Graph, a single DBpedia Identifier (a Hyperlink constructed in line with Linked Data Principles) offers a powerful conduit between the spreadsheet data and data from other data sources i.e., Super Keys.
Think of DBpedia as a major hub in a Giant Global Graph for powerful integration only limited by our imagination.
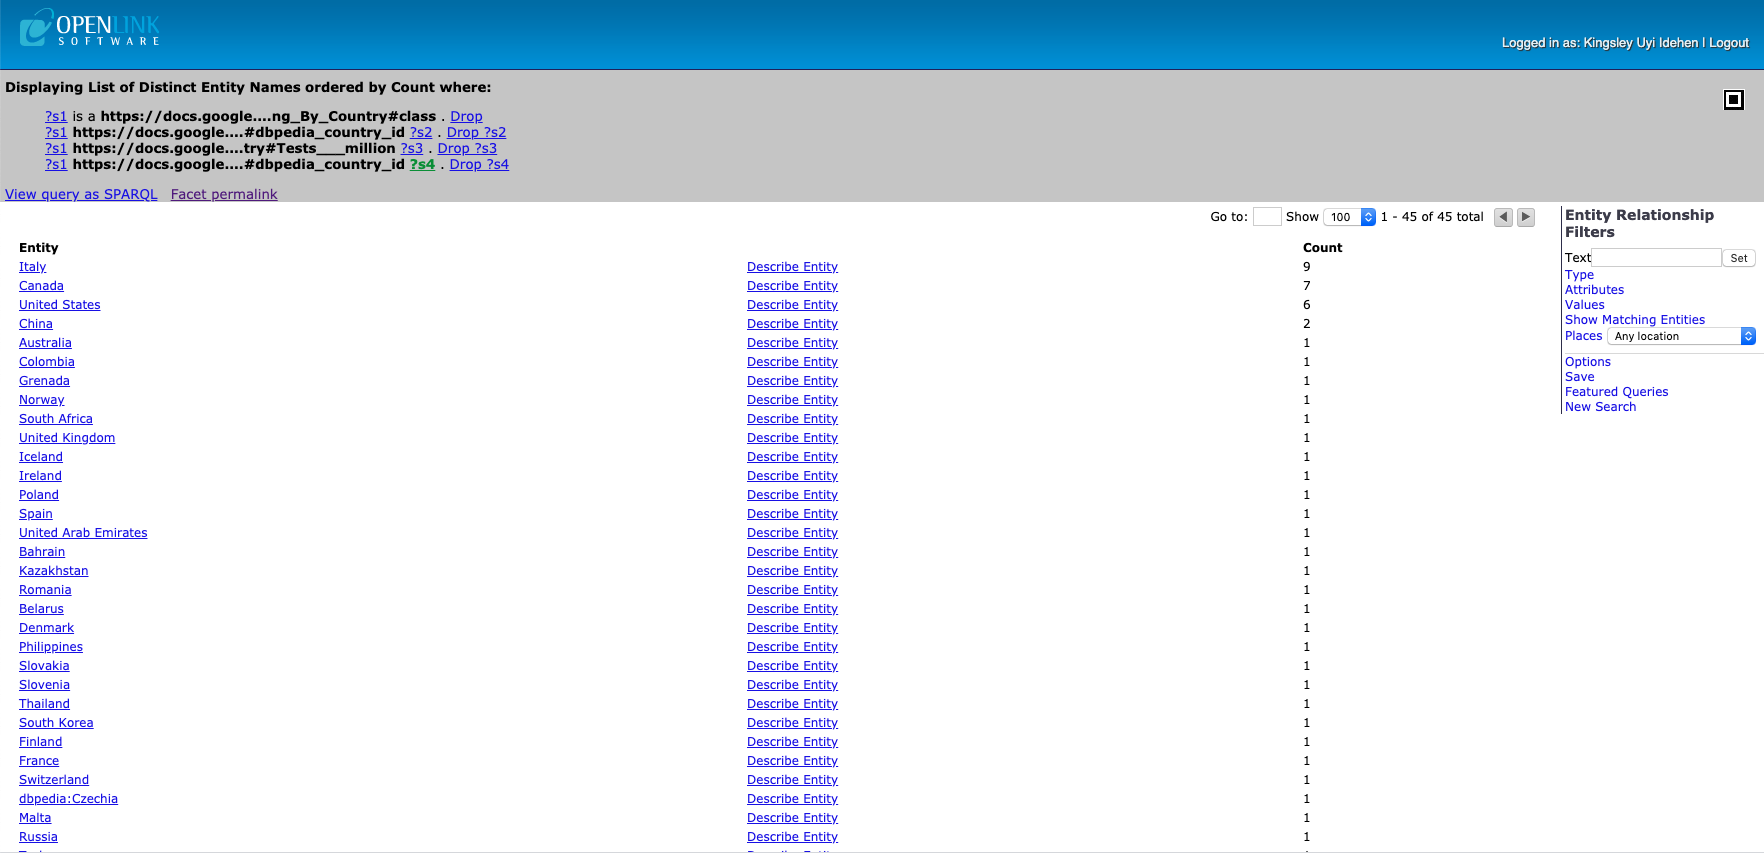
Here are links to pages that use the Wikipedia Testing Totals By Country Spreadsheet as starting point for DBpedia integration examples.
- All Countries – click on the “describe” link to get details about a country that catches your interest.
Select Countries
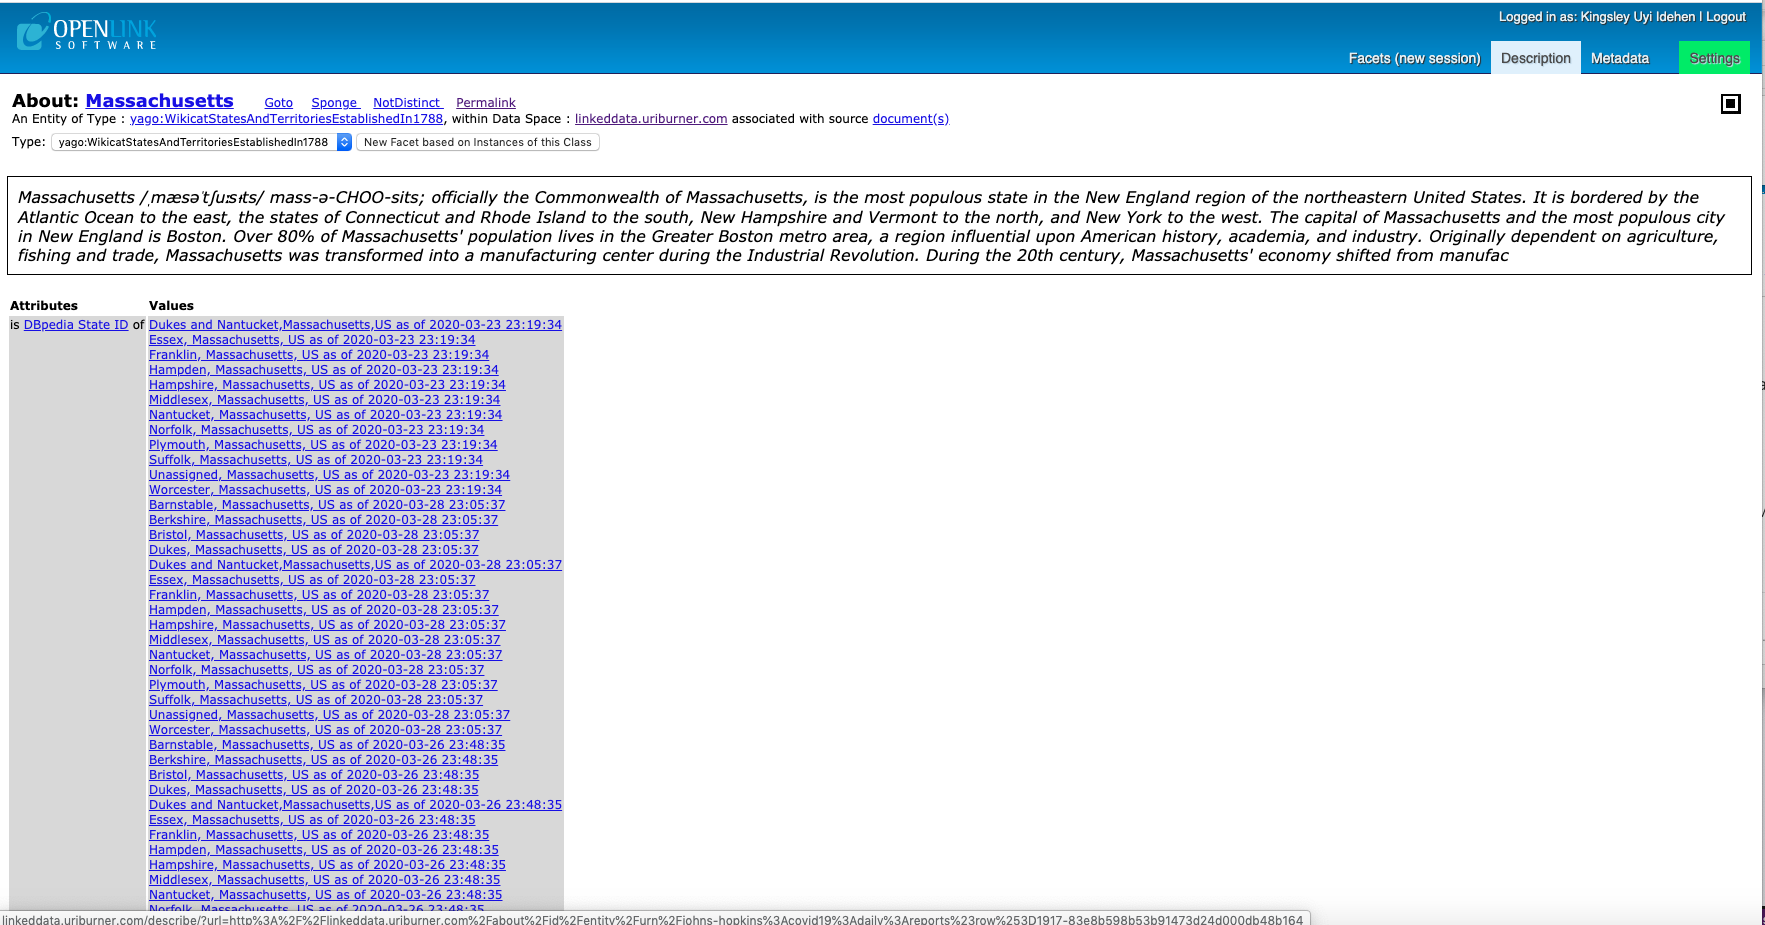
Select States
- Massachusetts – showcasing effects of semantic recombination (meshing) of COVID-19 data from various sources (e.g., Johns Hopkins Daily CSV Collection)
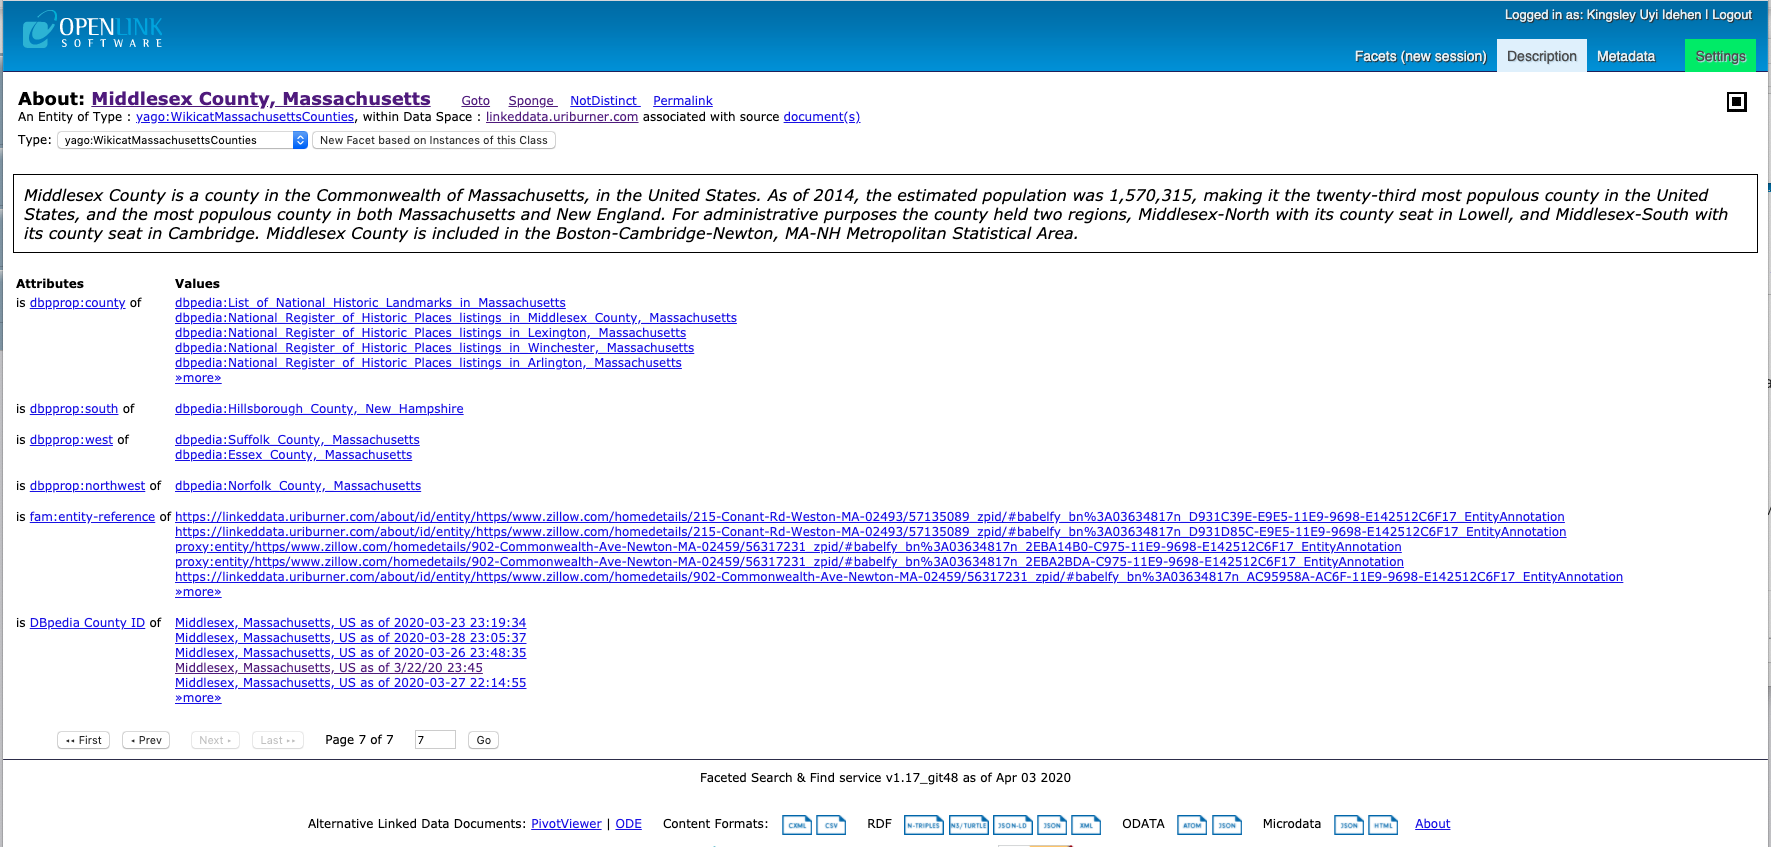
Select Counties within a State
CSV Documents
- https://github.com/nextstrain/ncov/raw/master/data/metadata.tsv – Nextstrain CSV comprising global SARS-CoV-2 specimen submissions to date (updated daily)
- http://covidtracking.com/api/states/daily.csv – US States Report from COVID-19 Tracking Project (updated 4pm EST daily)
- European Center for Disease Control (ECDC) – from Our World In Data COVID-19 Github Repository (updated daily)
CSV Document Collections Mapped & Transformed to RDF deployed using Linked Data Principles
- COVID-19/csse_covid_19_data/csse_covid_19_daily_reports at master · CSSEGISandData/COVID-19 · GitHub – Johns Hopkins Daily COVID-19 Reports Collection
Ontologies generated by CSV Extractor Cartridge
These hyperlinks that identify each ontology also adhere to Linked Data principles, so clicking on each link provides a guided exploration of the Knowledge Graph generated from the Spreadsheet content transformations.
- Our World In Data – Consolidated Spreadsheet
- Our World In Data – Testing Data Spreadsheet 2
- Our World In Data Full CSV
- Nextstrain
- Nextstrain CSV
- SARS_COV_2_Ancestry
- Worldometers
- Wikipedia
- COVID-19 Tracking Project – Cumulative Tracking by State Ontology
- COVID-19 Tracking Project – Daily Tracking Ontology
- DBpedia States to ISO Codes Mapping – DBpedia State ISO Codes Mapping Ontology
- Johns Hopkins COVID-19 Tracking Project – Ontology derived from Daily Tracking CSV Collection
- Kaiser Hospital ICU Tracking By US County – Ontology derived from Kaiser_ICUs_By_US_County Spreadsheet
SPARQL Query Results
Note, each hyperlink that identifies a spreadsheet also functions as the Named Graph identifier for organizing the RDF relations (generated by the Virtuoso Sponger) that are stored in the Virtuoso DBMS.
Here are query results targeting each of the Spreadsheets above, courtesy of the Sponger CSV Extractor Cartridge.
- Our World in Data – Consolidated Spreadsheet
- Our World In Data Average Testing by Country – Testing Data Spreadsheet 2
- Our World In Data – Testing Data Spreadsheet 2
- Nexstrain TSV – that includes the benefits of additional forward-chained data from SPARQL INSERTS that integrate into the LOD Cloud Knowledge Graph via DBpedia Country Identifiers (by default this query is scoped to a selection of countries)
- SARS_COV_2 Accession Identifiers – matched to NCBI Identifiers
- Worldometers – Worldometers Spreadsheet
- Wikipedia – Wikipedia Testing By Country Spreadsheet derived from HTML Table
- COVID-19 Cumulative Tracking – across states in the USA
- COVID-19 Daily Tracking – across states in the USA
- DBpedia State to ISO Code Mappings
- Johns Hopkins COVID-19 Daily Tracking by US State and County
- Johns Hopkins COVID-19 Daily Tracking Open Data and Various Dashboards Meshup by Country
- Index for various COVID-19 Dashboards by Country
- Kaiser Hospital ICU Tracking by US County
- Nextstrain and NIH Cross References – regarding Genomics of SARS-CoV-2 Samples from laboratories across the world
Each of these query results documents specifically include hyperlinks that adhere to Linked Data principles so that a user or a machine can explore further using the follow-your-nose approach.
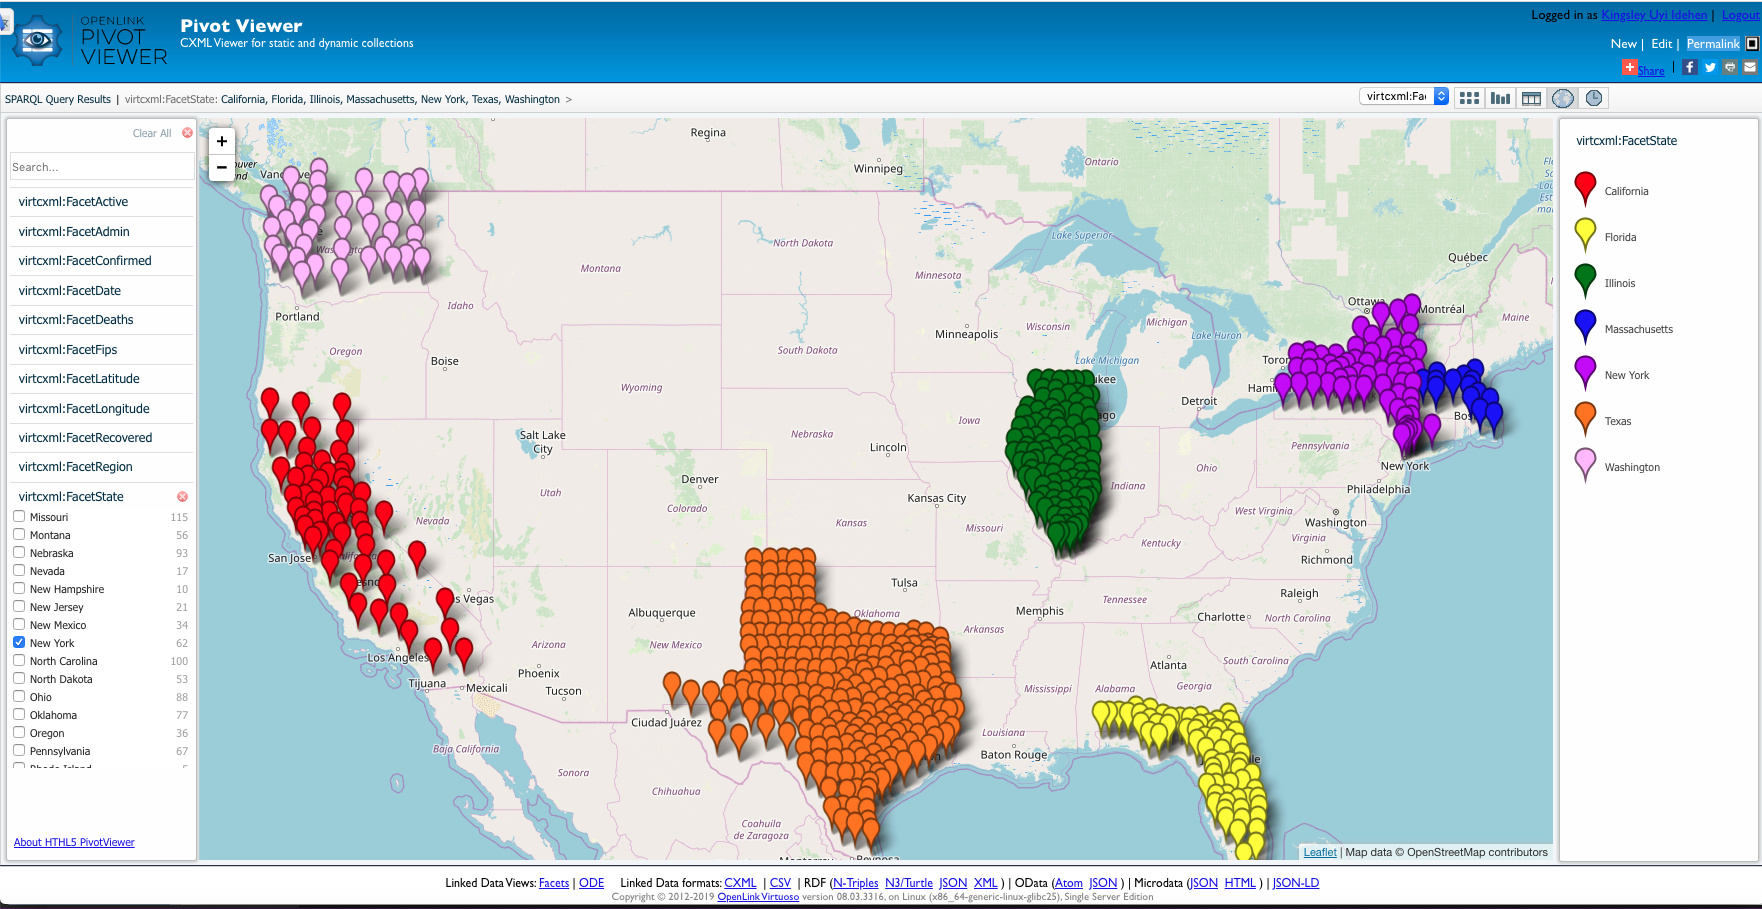
PivotViewer Reports
Here are some visual reports that take the output from SPARQL Queries (SELECT, DESCRIBE, or CONSTRUCT) and present for exploration and drill-down using the HTML5-based PivotViewer integrated into Virtuoso.
Additional Data Integration Challenge
Thus far, we’ve generated a Knowledge Graph comprising Linked Data originating from Open Data via the following steps:
- imported data Google Spreadsheet using the importData() function – in some cases using a SPARQL query URL as the data source argument
- incorporated DBpedia Identifiers for each country within each Google Spreadsheet
- generated 5-Star Linked Data from each of the Google Spreadsheets using the Virtuoso Sponger instance from our URIBurner instance which is a major LOD Cloud Gateway
This still leaves us with the need to mesh (semantically recombine) data across the various data sources (identified by Named Graph IRIs) in the Virtuoso DBMS en route to a rich knowledge substrate that removes this Data Wrangling burden from other data consumers.
Reasoning and Inference
To solve the data integration issue outlined above we need to leverage the power of reasoning and inference via a set of rules informed by the semantics of relationship types that constitute the Knowledge Graph in its evolving state.
Here are a collection of rules, described using RDF-Turtle Notation, that informs Virtuoso about how to mesh data across named graphs along the following lines:
-
Identify Relations that are Inverse-Functional in nature – i.e., columns in the original spreadsheet that hold values that uniquely identify a given row (handled by owl:inverseFunctionalProperty relationship type [relation] semantics) across the entire workbook (a Foreign Key for Relational Tables)
-
Identify Relations that are equivalent – i.e., columns in the original spreadsheet that are the same despite variation in labelling (handled by owl:equivalentClass relation semantics)
-
Identify Relations that are party of a hierarchy – i.e., columns in the original spreadsheet that are hierarchically subsumed by others as the basis for applying equivalence to values (handled by rdfs:subPropertyOf relation semantics)
## Turtle Start ##
@prefix lod:  <http://lod.openlinksw.com/> .
@prefix rdfs:  <http://www.w3.org/2000/01/rdf-schema#> .
@prefix schema: <http://schema.org/> .
@prefix owl:    <http://www.w3.org/2002/07/owl#> .
@prefix consolidated: <https://docs.google.com/spreadsheets/d/1Z0csxYkWFuvNpfaGQDKnhqdREHcwYbvd3s7vHsWsT5Q/gviz/tq?tqx=out:csv&sheet=Consolidated#> .
@prefix testing-2: <https://docs.google.com/spreadsheets/d/1Z0csxYkWFuvNpfaGQDKnhqdREHcwYbvd3s7vHsWsT5Q/gviz/tq?tqx=out:csv&sheet=Testing_By_Country2#> .
@prefix nextstrain: <https://docs.google.com/spreadsheets/d/1Z0csxYkWFuvNpfaGQDKnhqdREHcwYbvd3s7vHsWsT5Q/gviz/tq?tqx=out:csv&sheet=nextstrain#> .
@prefix sarscov2: <https://docs.google.com/spreadsheets/d/1Z0csxYkWFuvNpfaGQDKnhqdREHcwYbvd3s7vHsWsT5Q/gviz/tq?tqx=out:csv&sheet=SARS_COV_2_Ancestry#> .
@prefix nextstrain-ncov: <https://github.com/nextstrain/ncov/raw/master/data/metadata.tsv#> .

consolidated:id
a rdf:Property ;
owl:equivalentProperty testing-2:dbpedia_country_id,
                       nextstrain:dbpedia_country_id .

nextstrain:genebank_accession
a rdf:Property, owl:InverseFunctionalProperty ;
owl:equivalentProperty sarscov2:Accession, nextstrain-ncov:genebank_accession ;
rdfs:subPropertyOf lod:ifp_like .

## Turtle End ##
Here is a visualization of the rule description.
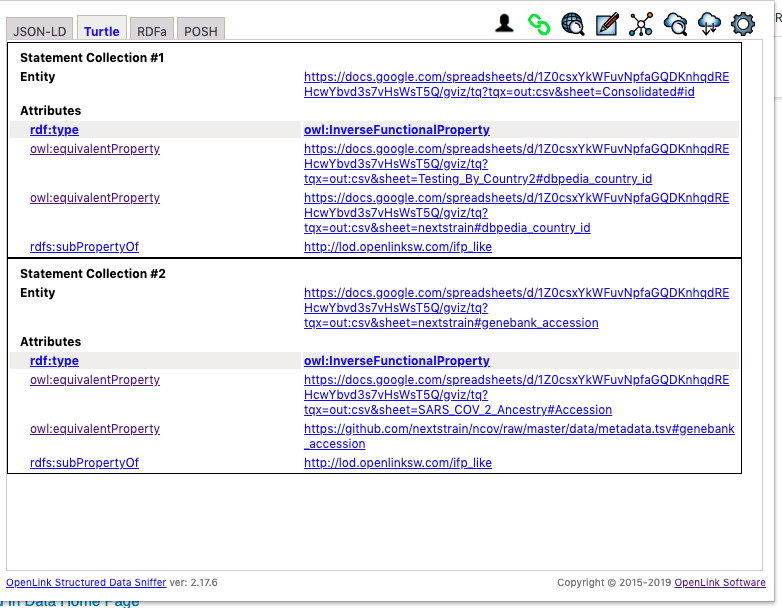
Here are sample SPARQL query demonstrating the impact of reasoning and inference when the inference rule above is enabled or disabled.
- Querying that leverages owl:equivalentProperty relations semantics – in this case, using columns (mapped to relations) in one spreadsheet (nexstrain) to provide a solution including records originating from another spreadsheet (consolidated)
DEFINE input:inference 'urn:covid19:meshup:ifp:rule'

PREFIX lod:  <http://lod.openlinksw.com/>
PREFIX rdfs:  <http://www.w3.org/2000/01/rdf-schema#>
PREFIX schema: <http://schema.org/>
PREFIX owl:    <http://www.w3.org/2002/07/owl#>
PREFIX consolidated: <https://docs.google.com/spreadsheets/d/1Z0csxYkWFuvNpfaGQDKnhqdREHcwYbvd3s7vHsWsT5Q/gviz/tq?tqx=out:csv&sheet=Consolidated#>
PREFIX testing-2: <https://docs.google.com/spreadsheets/d/1Z0csxYkWFuvNpfaGQDKnhqdREHcwYbvd3s7vHsWsT5Q/gviz/tq?tqx=out:csv&sheet=Testing_By_Country2#>
PREFIX nextstrain: <https://docs.google.com/spreadsheets/d/1Z0csxYkWFuvNpfaGQDKnhqdREHcwYbvd3s7vHsWsT5Q/gviz/tq?tqx=out:csv&sheet=nextstrain#>
PREFIX sarscov2: <https://docs.google.com/spreadsheets/d/1Z0csxYkWFuvNpfaGQDKnhqdREHcwYbvd3s7vHsWsT5Q/gviz/tq?tqx=out:csv&sheet=SARS_COV_2_Ancestry#>
PREFIX consolidated-sheet: <https://docs.google.com/spreadsheets/d/1Z0csxYkWFuvNpfaGQDKnhqdREHcwYbvd3s7vHsWsT5Q/gviz/tq?tqx=out:csv&sheet=Consolidated>
PREFIX testing-2-sheet: <https://docs.google.com/spreadsheets/d/1Z0csxYkWFuvNpfaGQDKnhqdREHcwYbvd3s7vHsWsT5Q/gviz/tq?tqx=out:csv&sheet=Testing_By_Country2>
PREFIX nextstrain-sheet: <https://docs.google.com/spreadsheets/d/1Z0csxYkWFuvNpfaGQDKnhqdREHcwYbvd3s7vHsWsT5Q/gviz/tq?tqx=out:csv&sheet=nextstrain>
PREFIX sarscov2-sheet: <https://docs.google.com/spreadsheets/d/1Z0csxYkWFuvNpfaGQDKnhqdREHcwYbvd3s7vHsWsT5Q/gviz/tq?tqx=out:csv&sheet=SARS_COV_2_Ancestry>
PREFIX nextstrain-metadata-tsv: <https://github.com/nextstrain/ncov/raw/master/data/metadata.tsv>

SELECT DISTINCT ?s ?p iri(?o)
FROM testing-2-sheet:
FROM consolidated-sheet:
FROM nextstrain-sheet:
FROM sarscov2-sheet:
FROM nextstrain-metadata-tsv:
WHERE {
        <https://linkeddata.uriburner.com/about/id/entity/https/docs.google.com/spreadsheets/d/1Z0csxYkWFuvNpfaGQDKnhqdREHcwYbvd3s7vHsWsT5Q/gviz/tq?tqx=out:csv&sheet=Consolidated#row%3D1311>
        nextstrain:dbpedia_country_id ?o.
        BIND (nextstrain:dbpedia_country_id as ?p)
        BIND (<https://linkeddata.uriburner.com/about/id/entity/https/docs.google.com/spreadsheets/d/1Z0csxYkWFuvNpfaGQDKnhqdREHcwYbvd3s7vHsWsT5Q/gviz/tq?tqx=out:csv&sheet=Consolidated#row%3D1311> as ?s)
      }
LIMIT 100
# Inference Invocation Pragma (query processor instructor) commented out
# DEFINE input:inference 'urn:covid19:meshup:ifp:rule'

PREFIX lod:  <http://lod.openlinksw.com/>
PREFIX rdfs:  <http://www.w3.org/2000/01/rdf-schema#>
PREFIX schema: <http://schema.org/>
PREFIX owl:    <http://www.w3.org/2002/07/owl#>
PREFIX consolidated: <https://docs.google.com/spreadsheets/d/1Z0csxYkWFuvNpfaGQDKnhqdREHcwYbvd3s7vHsWsT5Q/gviz/tq?tqx=out:csv&sheet=Consolidated#>
PREFIX testing-2: <https://docs.google.com/spreadsheets/d/1Z0csxYkWFuvNpfaGQDKnhqdREHcwYbvd3s7vHsWsT5Q/gviz/tq?tqx=out:csv&sheet=Testing_By_Country2#>
PREFIX nextstrain: <https://docs.google.com/spreadsheets/d/1Z0csxYkWFuvNpfaGQDKnhqdREHcwYbvd3s7vHsWsT5Q/gviz/tq?tqx=out:csv&sheet=nextstrain#>
PREFIX sarscov2: <https://docs.google.com/spreadsheets/d/1Z0csxYkWFuvNpfaGQDKnhqdREHcwYbvd3s7vHsWsT5Q/gviz/tq?tqx=out:csv&sheet=SARS_COV_2_Ancestry#>
PREFIX consolidated-sheet: <https://docs.google.com/spreadsheets/d/1Z0csxYkWFuvNpfaGQDKnhqdREHcwYbvd3s7vHsWsT5Q/gviz/tq?tqx=out:csv&sheet=Consolidated>
PREFIX testing-2-sheet: <https://docs.google.com/spreadsheets/d/1Z0csxYkWFuvNpfaGQDKnhqdREHcwYbvd3s7vHsWsT5Q/gviz/tq?tqx=out:csv&sheet=Testing_By_Country2>
PREFIX nextstrain-sheet: <https://docs.google.com/spreadsheets/d/1Z0csxYkWFuvNpfaGQDKnhqdREHcwYbvd3s7vHsWsT5Q/gviz/tq?tqx=out:csv&sheet=nextstrain>
PREFIX sarscov2-sheet: <https://docs.google.com/spreadsheets/d/1Z0csxYkWFuvNpfaGQDKnhqdREHcwYbvd3s7vHsWsT5Q/gviz/tq?tqx=out:csv&sheet=SARS_COV_2_Ancestry>
PREFIX nextstrain-metadata-tsv: <https://github.com/nextstrain/ncov/raw/master/data/metadata.tsv>

SELECT DISTINCT ?s ?p iri(?o)
FROM testing-2-sheet:
FROM consolidated-sheet:
FROM nextstrain-sheet:
FROM sarscov2-sheet:
FROM nextstrain-metadata-tsv:
WHERE {
        <https://linkeddata.uriburner.com/about/id/entity/https/docs.google.com/spreadsheets/d/1Z0csxYkWFuvNpfaGQDKnhqdREHcwYbvd3s7vHsWsT5Q/gviz/tq?tqx=out:csv&sheet=Consolidated#row%3D1311>
        nextstrain:dbpedia_country_id ?o.
        BIND (nextstrain:dbpedia_country_id as ?p)
        BIND (<https://linkeddata.uriburner.com/about/id/entity/https/docs.google.com/spreadsheets/d/1Z0csxYkWFuvNpfaGQDKnhqdREHcwYbvd3s7vHsWsT5Q/gviz/tq?tqx=out:csv&sheet=Consolidated#row%3D1311> as ?s)
      }
LIMIT 100
Visual Aesthetics oriented Reasoning and Inference
Hyperlinks as identifiers are powerful. That said, for data presentation and visualization they present immense challenges which has always been on of the impediments to broad exploitation and understanding. HTML solved this problem via the anchor-tag ({some-label}), and we solve this challenge using inference rules.
Here are examples of rules that inform Virtuoso about how and when to replace raw hyperlinks with labels. Note, these rules are executed as SQL commands that leverage Virtuoso’s support for both SQL and SPARQL declarative query languages.
-- Sponger's About Pages (the same UI skin you see in DBpedia)

SPARQL
PREFIX nextstrain-sheet-csv: <https://docs.google.com/spreadsheets/d/1Z0csxYkWFuvNpfaGQDKnhqdREHcwYbvd3s7vHsWsT5Q/gviz/tq?tqx=out:csv&sheet=nextstrain_csv#>
PREFIX nextstrain-sheet: <https://docs.google.com/spreadsheets/d/1Z0csxYkWFuvNpfaGQDKnhqdREHcwYbvd3s7vHsWsT5Q/gviz/tq?tqx=out:csv&sheet=nextstrain#>
PREFIX worldometer: <https://docs.google.com/spreadsheets/d/1Z0csxYkWFuvNpfaGQDKnhqdREHcwYbvd3s7vHsWsT5Q/gviz/tq?tqx=out:csv&sheet=worldometers&range=A3:K168#>
PREFIX consolidated: <https://docs.google.com/spreadsheets/d/1Z0csxYkWFuvNpfaGQDKnhqdREHcwYbvd3s7vHsWsT5Q/gviz/tq?tqx=out:csv&sheet=Consolidated#>

INSERT INTO GRAPH <virtrdf-label>
{
  nextstrain-sheet-csv:strain rdfs:subPropertyOf  virtrdf:label  .
  nextstrain-sheet:strain rdfs:subPropertyOf  virtrdf:label  .
  worldometer:Country__Other rdfs:subPropertyOf  virtrdf:label  .
  consolidated:location rdfs:subPropertyOf  virtrdf:label  .
} ;

rdfs_rule_set ('virtrdf-label', 'virtrdf-label');
p_score_init ();

-- Faceted Browsing Engine

SPARQL
PREFIX nextstrain-sheet-csv: <https://docs.google.com/spreadsheets/d/1Z0csxYkWFuvNpfaGQDKnhqdREHcwYbvd3s7vHsWsT5Q/gviz/tq?tqx=out:csv&sheet=nextstrain_csv#>
PREFIX nextstrain-sheet: <https://docs.google.com/spreadsheets/d/1Z0csxYkWFuvNpfaGQDKnhqdREHcwYbvd3s7vHsWsT5Q/gviz/tq?tqx=out:csv&sheet=nextstrain#>
PREFIX worldometer: <https://docs.google.com/spreadsheets/d/1Z0csxYkWFuvNpfaGQDKnhqdREHcwYbvd3s7vHsWsT5Q/gviz/tq?tqx=out:csv&sheet=worldometers&range=A3:K168#>
PREFIX consolidated: <https://docs.google.com/spreadsheets/d/1Z0csxYkWFuvNpfaGQDKnhqdREHcwYbvd3s7vHsWsT5Q/gviz/tq?tqx=out:csv&sheet=Consolidated#>

INSERT INTO GRAPH <facets>
  {
    nextstrain-sheet-csv:strain rdfs:subPropertyOf  virtrdf:label  .
    nextstrain-sheet:strain rdfs:subPropertyOf  virtrdf:label  .
    worldometer:Country__Other rdfs:subPropertyOf  virtrdf:label  .
    consolidated:location rdfs:subPropertyOf  virtrdf:label  .
  } ;

--Making the rule from the graph:
rdfs_rule_set ('facets', 'facets');

-- extend to other rules e.g. facet using virtrdf-label rule.

rdfs_rule_set ('facets', 'virtrdf-label');

-- verify rule existence

SELECT rs_name FROM sys_rdf_schema
WHERE rs_name = 'facets' OR rs_name = 'virtrdf-label' ;
Here are examples of pages that demonstrate the effect of these aesthetic rules.
Related
- Querying Google Spreadsheets using SQL
- Our World In Data Home Page
- Nextstrain Github Repository
- Life Sciences Sub-Cloud within Linked Open Data Cloud Knowledge Graph
- Tweets related to Our World In Data, Linked Data, Knowledge Graph, and COVID-19 on Twitter
- Tweets related to Nextstrain, Linked Data, Knowledge Graph, and COVID-19 on Twitter
- Initial LinkedIn Post about Open Data from Our World In Data
- Initial LinkedIn Post about Open Data from Nextstrain
- Various LinkedIn posts related to Linked Data, Knowledge Graph, and COVID-19
- What is the LOD Cloud, and why is it important?
- What is the Virtuoso Sponger Middleware about, and why is it important?
- Simple Linked Data Deployment Tutorial
- COVID-19 Repository – comprising Virtuoso SQL Script for creating and verifying Inference Rules for LOD Cloud Knowledge Graph Integration
- COVID-19 Index from my Notes – i.e., using personal notes about COVID19 to build a Content Index that also integrates with the LOD Cloud Knowledge Graph
- COVID-19 KnowledgeGraph deployed via HTML5 Document
- Unleashing the FORCE of the LOD Cloud Knowledge Graph on COVID-19 Presentation
- Unleashing the FORCE of the LOD Cloud Knowledge Graph on COVID-19 YouTube Video Presentation – from Knowledge Graphs for Fighting COVID-19 Virtual Meetup
- Data Wrangling and Progressive LOD Cloud Knowledge Graph Enhancement – Beyond Spreadsheets