Windows Client-side ODBC Administrator Traces and OpenLink Driver Debug Logs Creation
Controlling ODBC Tracing with the Microsoft ODBC Administrator
-
Quit all ODBC client applications.
-
Open your Data Sources (ODBC) control panel (often found in the Administrative Tools subfolder).
-
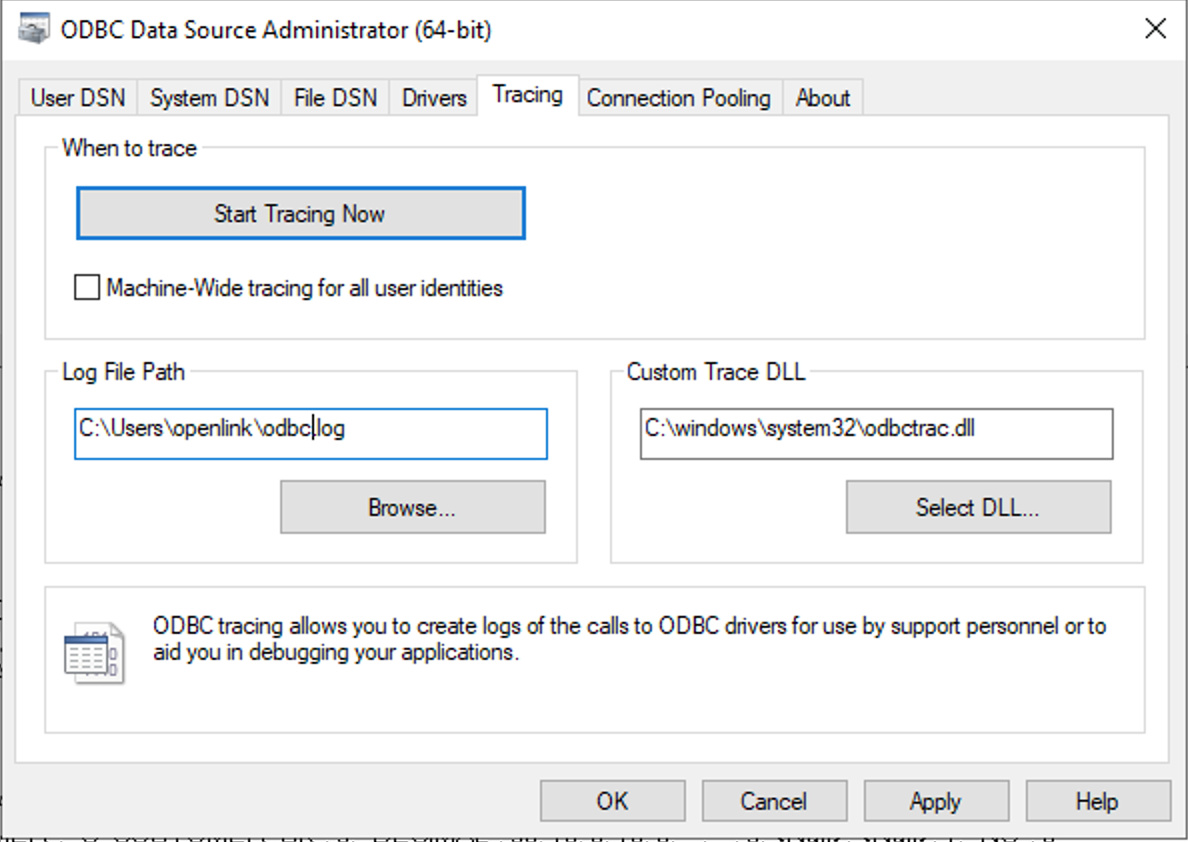
Click the Tracing tab.
-
Locate the Log File Path field.
-
Use the Log File Path field to specify the complete location of the file to which you wish to write the trace, e.g.,
C:\Temp\odbc.trace.txt.
- You may use the Browse button to locate or create the file, or specify it manually.
-
If the ODBC client application(s) you need to trace will run as System or under any other user login than your own, click the Machine-Wide tracing for all user identities box. This option is often necessary, even though it doesn’t seem like it should be.
-
Click the Start Tracing Now button, and exit the Data Sources (ODBC) control panel.
-
Reopen the ODBC client application.
-
Recreate the error condition.
-
Locate the file(s) indicated in the log file path on the tracing tab.
-
DISABLE TRACING ON THE TRACING TAB. Failure to do this will leave the logs running, which can overflow your disk, and will have significant impact on performance.
OpenLink Driver Debug logging on Windows
Controlling OpenLink Driver Debug logging through the Client Configuration Utility
-
Launch the OpenLink Client Configuration Utility,
oplcfg32.exe. -
Click to the ODBC tab.
-
Set a target for the Debug File to the full path to your chosen log target. Note: The filename tokens described above may be used for Driver Debug logging, but they will have no effect on MDAC Tracing. For example:
C:\Program Files\OpenLink\Lite32\mydebug.$t.log
-
Recreate your error message or error condition.
-
Locate your debug log.
-
Return to the Registry Editor (regedit), and unset DebugFile. Failure to do this will leave the logs running, which can overflow your disk, and will have significant impact on performance.
Controlling OpenLink Driver Debug logging through the Registry Editor
-
Open a DOS or CMD window on your Windows client.
-
Run the regedit command. For example:
C:\> regedit
-
Expand the HKEY_LOCAL_MACHINE\Software\OpenLink Software menu items.
-
Locate the folder for the driver you’re using, and the ODBC subfolder within that.
-
Locate the DebugFile parameter. It will appear on the right side of regedit.
-
Set DebugFile to the full path to your chosen log target. Note: The filename tokens described above may be used for Driver Debug logging, but they will have no effect on MDAC Tracing. For example:
C:\Program Files\OpenLink\Lite32\mydebug.$t.log
-
Recreate your error message or error condition.
-
Locate your debug log.
-
Return to the Registry Editor (regedit), and unset DebugFile. Failure to do this will leave the logs running, which can overflow your disk, and will have significant impact on performance.
Extra Driver Debug Logging for Single-Tier “Express” Edition ODBC Drivers, Single-Tier “Lite” Edition ODBC-to-JDBC Bridge, or Multi-Tier “Enterprise” Edition JDBC Bridge Agent on Windows
The Express Edition driver is a DBMS-specific bundling of our “Lite” Edition ODBC Driver for JDBC Data Sources (also known as ODBC-JDBC Bridge Driver) with a DBMS-specific Type 4 JDBC Driver. Sometimes, troubleshooting requires looking into the Java calls made by the ODBC-JDBC Bridge, and the responses from the JDBC Driver. Similar logging may be needed with our “Lite” Edition ODBC Driver for JDBC Data Sources, or our “Enterprise” Edition Bridge Agent for JDBC Data Sources. These calls are logged within the Driver or Agent Debug Log by setting an environment variable –
When Java-level troubleshooting is complete, you can set LOG_JAVA_CALLS to NO, or just leave it as-is if you disable Driver and Agent Debug Logging. (The LOG_JAVA_CALLS setting has no effect when Driver and Agent Debug Logging are inactive.)
Filename tokens, valid for all platforms
In iODBC 3.51.0 and later, and UDA Release 5.2 and later, there are some tokens that may be included in the target file names to make them more easily identified when prolonged tracing, or tracing of multiple connections and/or applications, is required:
| Token | Expands to |
|---|---|
| $T | a timestamp in YYYYMMDD-hhmmss format |
| $H | the home-directory of the user as whom the process is running |
| $P | the process-id (pid) of the application which invokes the driver manager, allowing for per-process log-files |
| $U | the user-id under which the process is currently running |
These options are case-insensitive, so, for instance, $p has the same effect as $P.
Hence you can specify, for example:
[ODBC]
Trace         = 1
TraceFile     = iodbc.$U.$p.$T.log
TraceAutoStop = 0
;TraceDLL      =
Debug         = 1
DebugFile     = openlink.$u.$P.$t.log
This would produce separate iODBC trace files and OpenLink driver debug logs with names based on the userid, timestamp, and processid of each connection made.
Note that these tokens have no effect on MDAC (Windows driver manager) trace files, but they do have effect on driver debug logs produced on Windows.