macOS Client-side ODBC Traces and Driver Debug Logs Creation
ODBC Tracing on Mac OS X
ODBC tracing may be controlled through the Tracing Tab of the OpenLink ODBC Administrator.app –
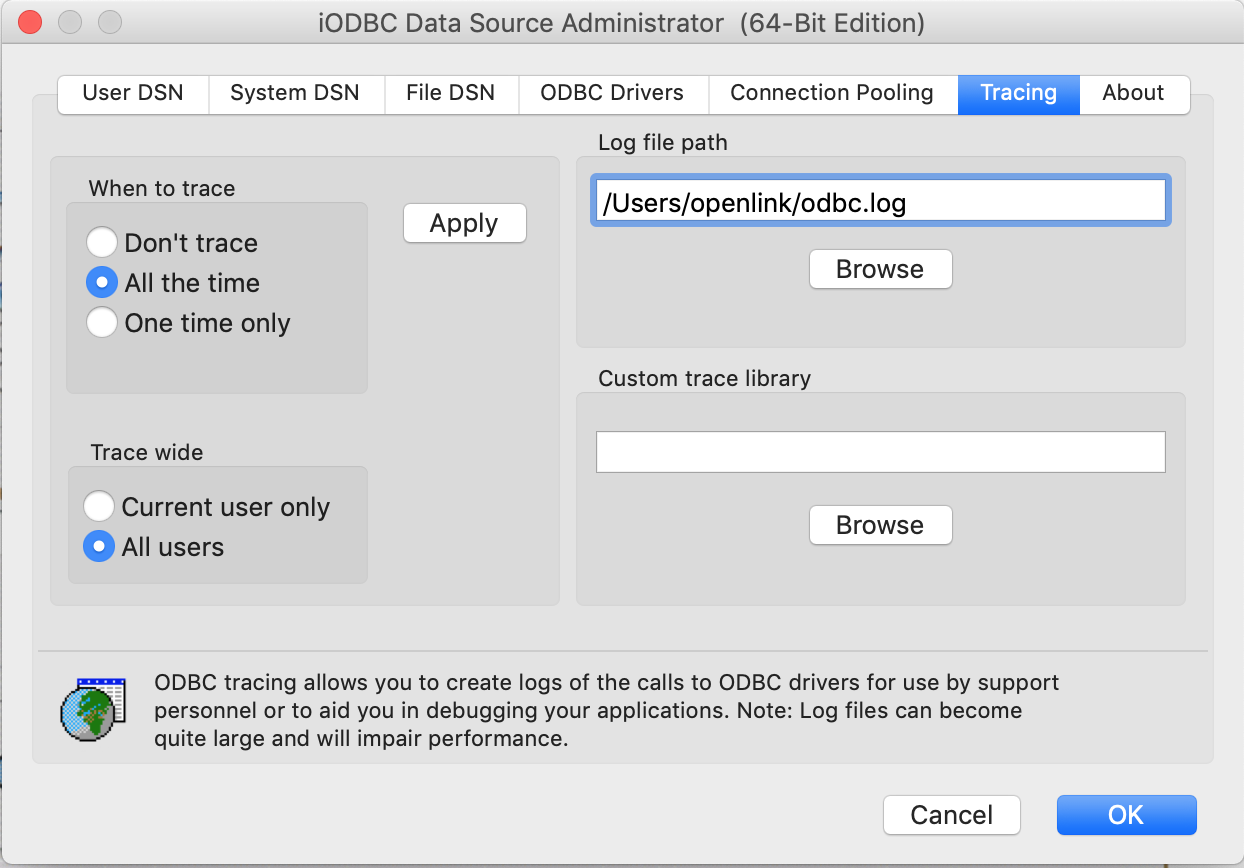
-
When to trace — Use this option to turn tracing off or on. For a One-time only trace, the trace is made only for the duration of the next connection (which may be over sooner than you expect). Click the Apply button to make your selection active. This option corresponds to the
TraceandTraceAutoStopparameters in the preference files. -
Custom trace library — Use the Select Library button to browse the machine for a library file that contains the code to intercept the trace output. This field should generally be left blank. When setting this parameter, you may use the Browse button to locate the library, or specify it manually. If specified manually, note that the location must be specified as it would be in a Terminal session. You may use ~/ as a shortcut to your user Home directory. This option corresponds to the
TraceDLLparameter in the preference files. -
Log file path — Specify the complete location of the file to which you wish to write the trace. You may use the Browse button to locate or create the file, or specify it manually. If specified manually, note that the location must be specified as it would be in a Terminal session. You may use
~/as a shortcut to your user Home directory. This option corresponds to the TraceFile parameter in the preference files. -
Trace Parameters in Preference Files — When the ODBC tracing parameters are changed, they are saved in the
[ODBC]section of theODBC.preferenceorodbc.inifile, whichever is active on your system.
The same settings may be adjusted by manually editing the relevant configuration file –
-
/Library/ODBC/odbc.ini– for system-wide tracing; generally recommended -
/Users/*/Library/ODBC/odbc.inior~/Library/ODBC/odbc.ini– for user-specific tracing; useful for rare but specific kinds of troubleshooting
The following example shows the settings for continuous driver manager tracing to files on the active user’s Desktop.
[ODBC]
Trace         = 1
TraceAutoStop = 0
;TraceDLL      =
TraceFile     = ~/Desktop/sql.trace.$p.$t.log
-
Trace — This parameter corresponds to the When to trace option in the Tracing tab. Set to
1, tracing is on; set to0, tracing is off. -
TraceAutoStop — This parameter corresponds to the One-time only option in the tracing tab. Set to
1, tracing will automatically stop after the next connection is closed; set to0, tracing must be manually stopped. When tracing is automatically stopped, theTraceandTraceAutoStopparameters will both be set to0. -
TraceDLL — This parameter corresponds to the Custom trace library option in the tracing tab, and is very rarely used. When setting this parameter, note that the file must be fully specified as it would be in a Terminal session, but without shell-escaping (i.e., spaces and other shell-reserved characters do not need to be escaped). You may use
~/as a shortcut to your user Home directory. -
TraceFile — This parameter corresponds to the Log file path option in the tracing tab. When setting this parameter, note that the file must be fully specified as it would be in a Terminal session, but without shell-escaping (i.e., spaces and other shell-reserved characters do not need to be escaped). You may use
~/as a shortcut to your user Home directory.
Driver Debug logging on Mac OS X
Driver Debug logging may be controlled through the DSN configuration (different panes for different drivers). Similar to ODBC tracing, there is a checkbox for turning this log on and off, and a text-entry box by which to specify the target file.
The same settings may be adjusted by manually editing the relevant configuration file –
-
/Library/ODBC/odbc.ini – for system-wide logging; generally recommended
-
/Users/*/Library/ODBC/odbc.ini or ~/Library/ODBC/odbc.ini – for user-specific tracing; useful for rare but specific kinds of troubleshooting
When set through a GUI-based Administrator DSN setup, debug logging is per-DSN. When manually set, debug logging may be per-DSN, or in the global [ODBC] stanza which applies to all DSNs.
The following example shows the settings for continuous driver debug logging, for all DSNs and all OpenLink ODBC drivers, to files on the active user’s Desktop.
[ODBC]
Debug         = 1
DebugFile     = ~/Desktop/sql.debug.$p.$t.log
-
Debug — This parameter corresponds to the checkbox in the DSN configuration. Set to
1, logging is on; set to0, logging is off. -
DebugFile — This parameter corresponds to the text-entry box in the DSN configuration. When setting this parameter, note that the file must be fully specified as it would be in a Terminal session, but without shell-escaping (i.e., spaces and other shell-reserved characters do not need to be escaped; it is as if the path were entered within double-quotes in a shell session). You may use ~/ as a shortcut to your user Home directory.
-
Note: There is no Auto-Stop for Driver Debug Logging – you must manually stop this logging.
Extra Driver Debug Logging for Single-Tier “Express” Edition ODBC Drivers, Single-Tier “Lite” Edition ODBC-to-JDBC Bridge, or Multi-Tier “Enterprise” Edition JDBC Bridge Agent on Mac OS X
The Express Edition driver is a DBMS-specific bundling of our “Lite” Edition ODBC Driver for JDBC Data Sources (also known as ODBC-JDBC Bridge Driver) with a DBMS-specific Type 4 JDBC Driver. Sometimes, troubleshooting requires looking into the Java calls made by the ODBC-JDBC Bridge, and the responses from the JDBC Driver. Similar logging may be needed with our “Lite” Edition ODBC Driver for JDBC Data Sources, or our “Enterprise” Edition Bridge Agent for JDBC Data Sources. These calls are logged within the Driver or Agent Debug Log by setting an environment variable – LOG_JAVA_CALLS – to YES.
When Java-level troubleshooting is complete, you can unset the variable, set it to NO, or just leave it as-is if you disable Driver and Agent Debug Logging. (The LOG_JAVA_CALLS setting has no effect when Driver and Agent Debug Logging are inactive.)
Catalina (10.15), Mojave (10.14), High Sierra (10.13), Sierra (10.12), El Capitan (10.11), Yosemite (10.10), Mavericks (10.9), Mountain Lion (10.8), or Lion (10.7)
As of Lion, these simple Terminal.app commands will do the job –
# to start including Java calls
launchctl setenv LOG_JAVA_CALLS YES

# to stop including Java calls
launchctl unsetenv LOG_JAVA_CALLS
Note that any active applications will not reflect the change; you have to quit and relaunch.
A reboot or user log out will unset variables set with these commands, and you’ll need to re-set them afterward. Persistent settings can be made through a launchd.plist, as described elsewhere.
Lion (10.7), Snow Leopard (10.6), Leopard (10.5), Tiger (10.4), Panther (10.3), Jaguar (10.2), Puma (10.1), or Cheetah (10.0)
On Mac OS X 10.6 and earlier, this is best done by creating (or editing) a file called environment.plist in a (normally invisible) directory called .MacOSX, in the user’s home directory. This method also works on Lion (10.7).
You can execute one of these commands in Terminal.app , to open the file for editing in TextEdit.app –
open -e /Users/ShortUsername/.MacOSX/environment.plist
open -e ~/.MacOSX/environment.plist
If the file already exists, just add these two lines to the main block –
        <key>LOG_JAVA_CALLS</key>
        <string>YES</string>
If you’re creating a new file, make sure it contains this entire block –
<?xml version="1.0" encoding="UTF-8"?>
<!DOCTYPE plist PUBLIC "-//Apple Computer//DTD PLIST 1.0//EN"
        "http://www.apple.com/DTDs/PropertyList-1.0.dtd">
<plist version="1.0">
<dict>
        <key>LOG_JAVA_CALLS</key>
        <string>YES</string>
</dict>
</plist>
Microsoft Excel ODBC tracing
Microsoft Excel in macOS is a sandboxed application and will only allow the writing of files to the /Users/{your-user}/Library/Containers/com.microsoft.Excel/Data folder where {your-user} is the name of the macOS user account you are running the application from. Thus for a user of openlink the location would be /Users/openlink/Library/Containers/com.microsoft.Excel/Data, which would be the location to specify for any ODBC traces file to be written to.
Filename tokens, valid for all platforms
In iODBC 3.51.0 and later, and UDA Release 5.2 and later, there are some tokens that may be included in the target file names to make them more easily identified when prolonged tracing, or tracing of multiple connections and/or applications, is required:
| Token | Expands to |
|---|---|
| $T | a timestamp in YYYYMMDD-hhmmss format |
| $H | the home-directory of the user as whom the process is running |
| $P | the process-id (pid) of the application which invokes the driver manager, allowing for per-process log-files |
| $U | the user-id under which the process is currently running |
These options are case-insensitive, so, for instance, $p has the same effect as $P.
Hence you can specify, for example:
[ODBC]
Trace         = 1
TraceFile     = iodbc.$U.$p.$T.log
TraceAutoStop = 0
;TraceDLL      =
Debug         = 1
DebugFile     = openlink.$u.$P.$t.log
This would produce separate iODBC trace files and OpenLink driver debug logs with names based on the userid, timestamp, and processid of each connection made.
Note that these tokens have no effect on MDAC (Windows driver manager) trace files, but they do have effect on driver debug logs produced on Windows.