hi
I am very much new to openlink virtuoso
Can someone explain how to create a Nosql graph data model using openlink virtuoso
It is bit of confusing. Can someone explain me the steps
This document on Five Simple Steps to Experience the Power of a Knowledge Graph, using Virtuoso, should server as a suitable starting point.
Sir how to visualize the graph data model is there any specific tool. And the documentation is not much clear.
Specifically what form of graph data model visualisation are you seeking ?
Have you looked at the Virtuoso Faceted Browser, that provides data discovery and visualisation features ?
1 Like
Hi @Menuka,
Virtuoso results can be visualized using Neo4j, if you are looking for a “graph-visualization”-style option: Adding Virtuoso SPARQL results to a Neo4j Property Graph
1 Like
Thanks for the reply
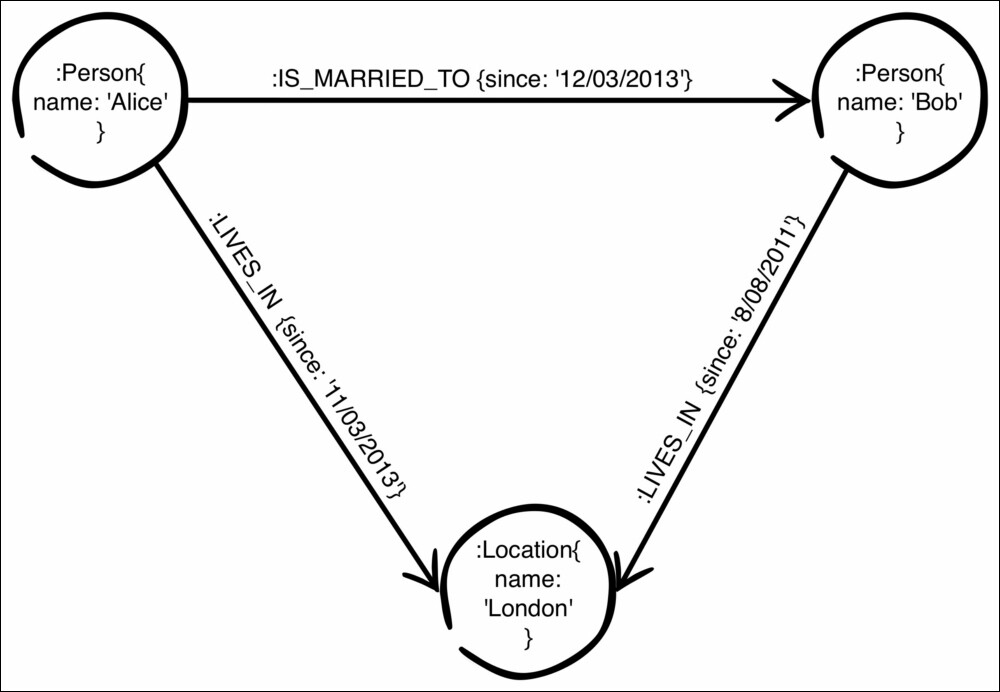
Sir I just want to create this form of graph. A graph created using bubbles. Is it possible using openlink virtuoso. Or should I have to use a another too for that
Sir is it possible to visualize graph data model only using openlink virtuoso.
Hi Menuka,
Are you looking for a tool that helps you replicate what’s depicted in your post? If so, then @danielhm (who replied earlier) has a utility that he prototyped they might meet your needs, in this regard.
If you are looking for something that visualizes the response to a query then you would require something different i.e., an RDF or Labeled Property Graph Visualization tool that supports Data Access using HTTP, ODBC, or JDBC.

Hi @Menuka:
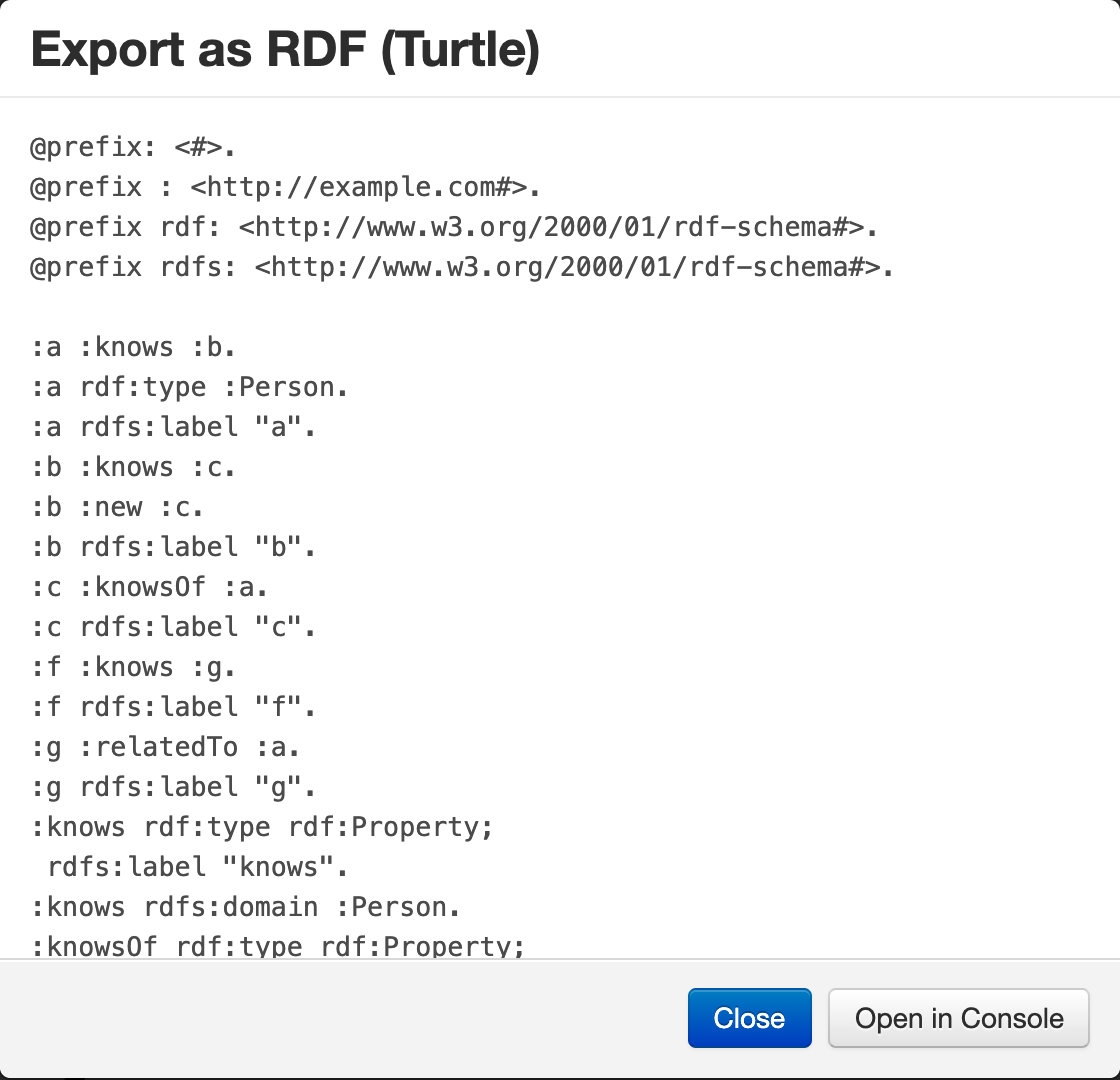
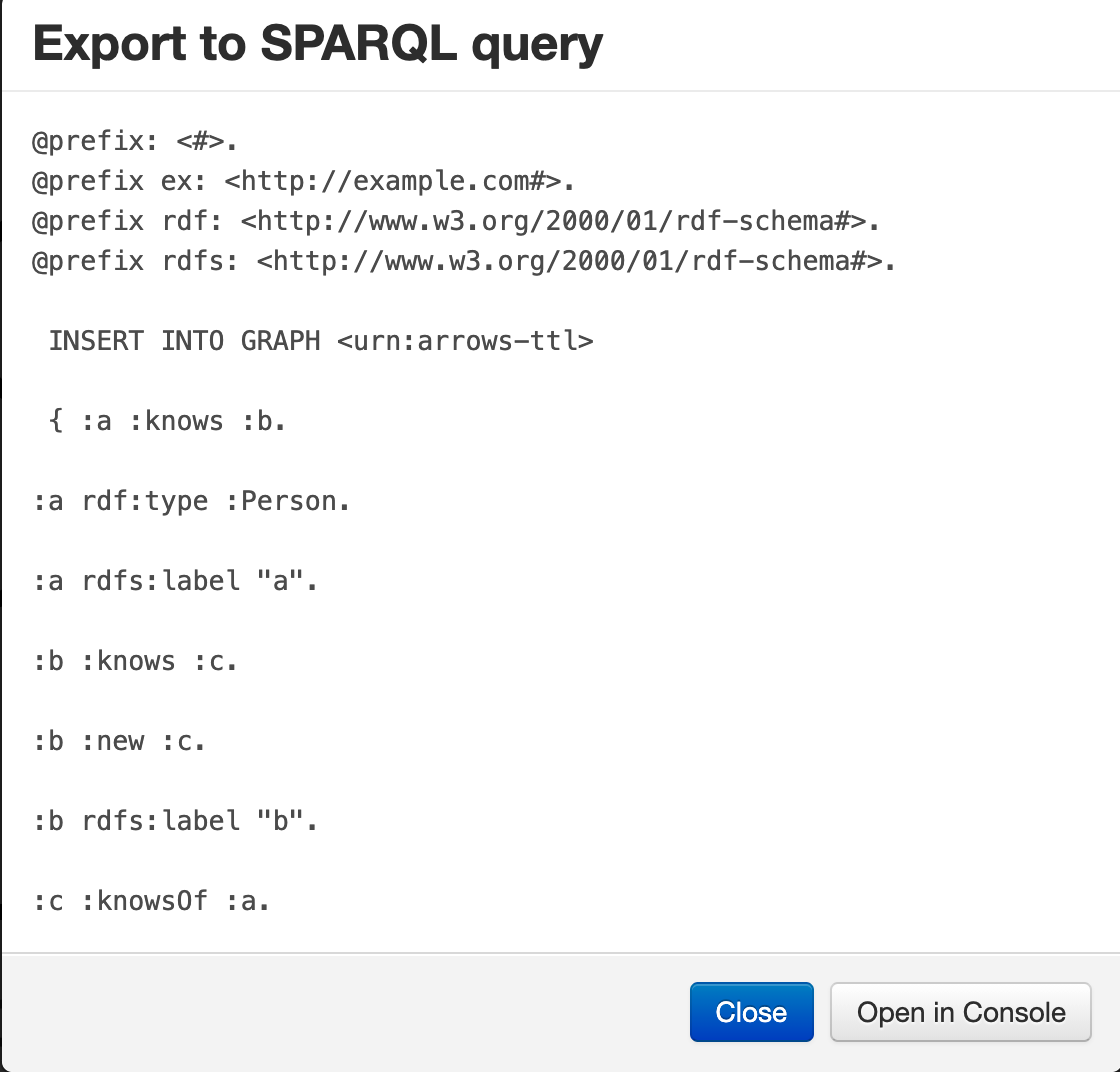
Here is my alpha release an my Arrows fork. This version allows the created “graph” to be returned using SPARQL INSERT and RDF-TURTLE output.
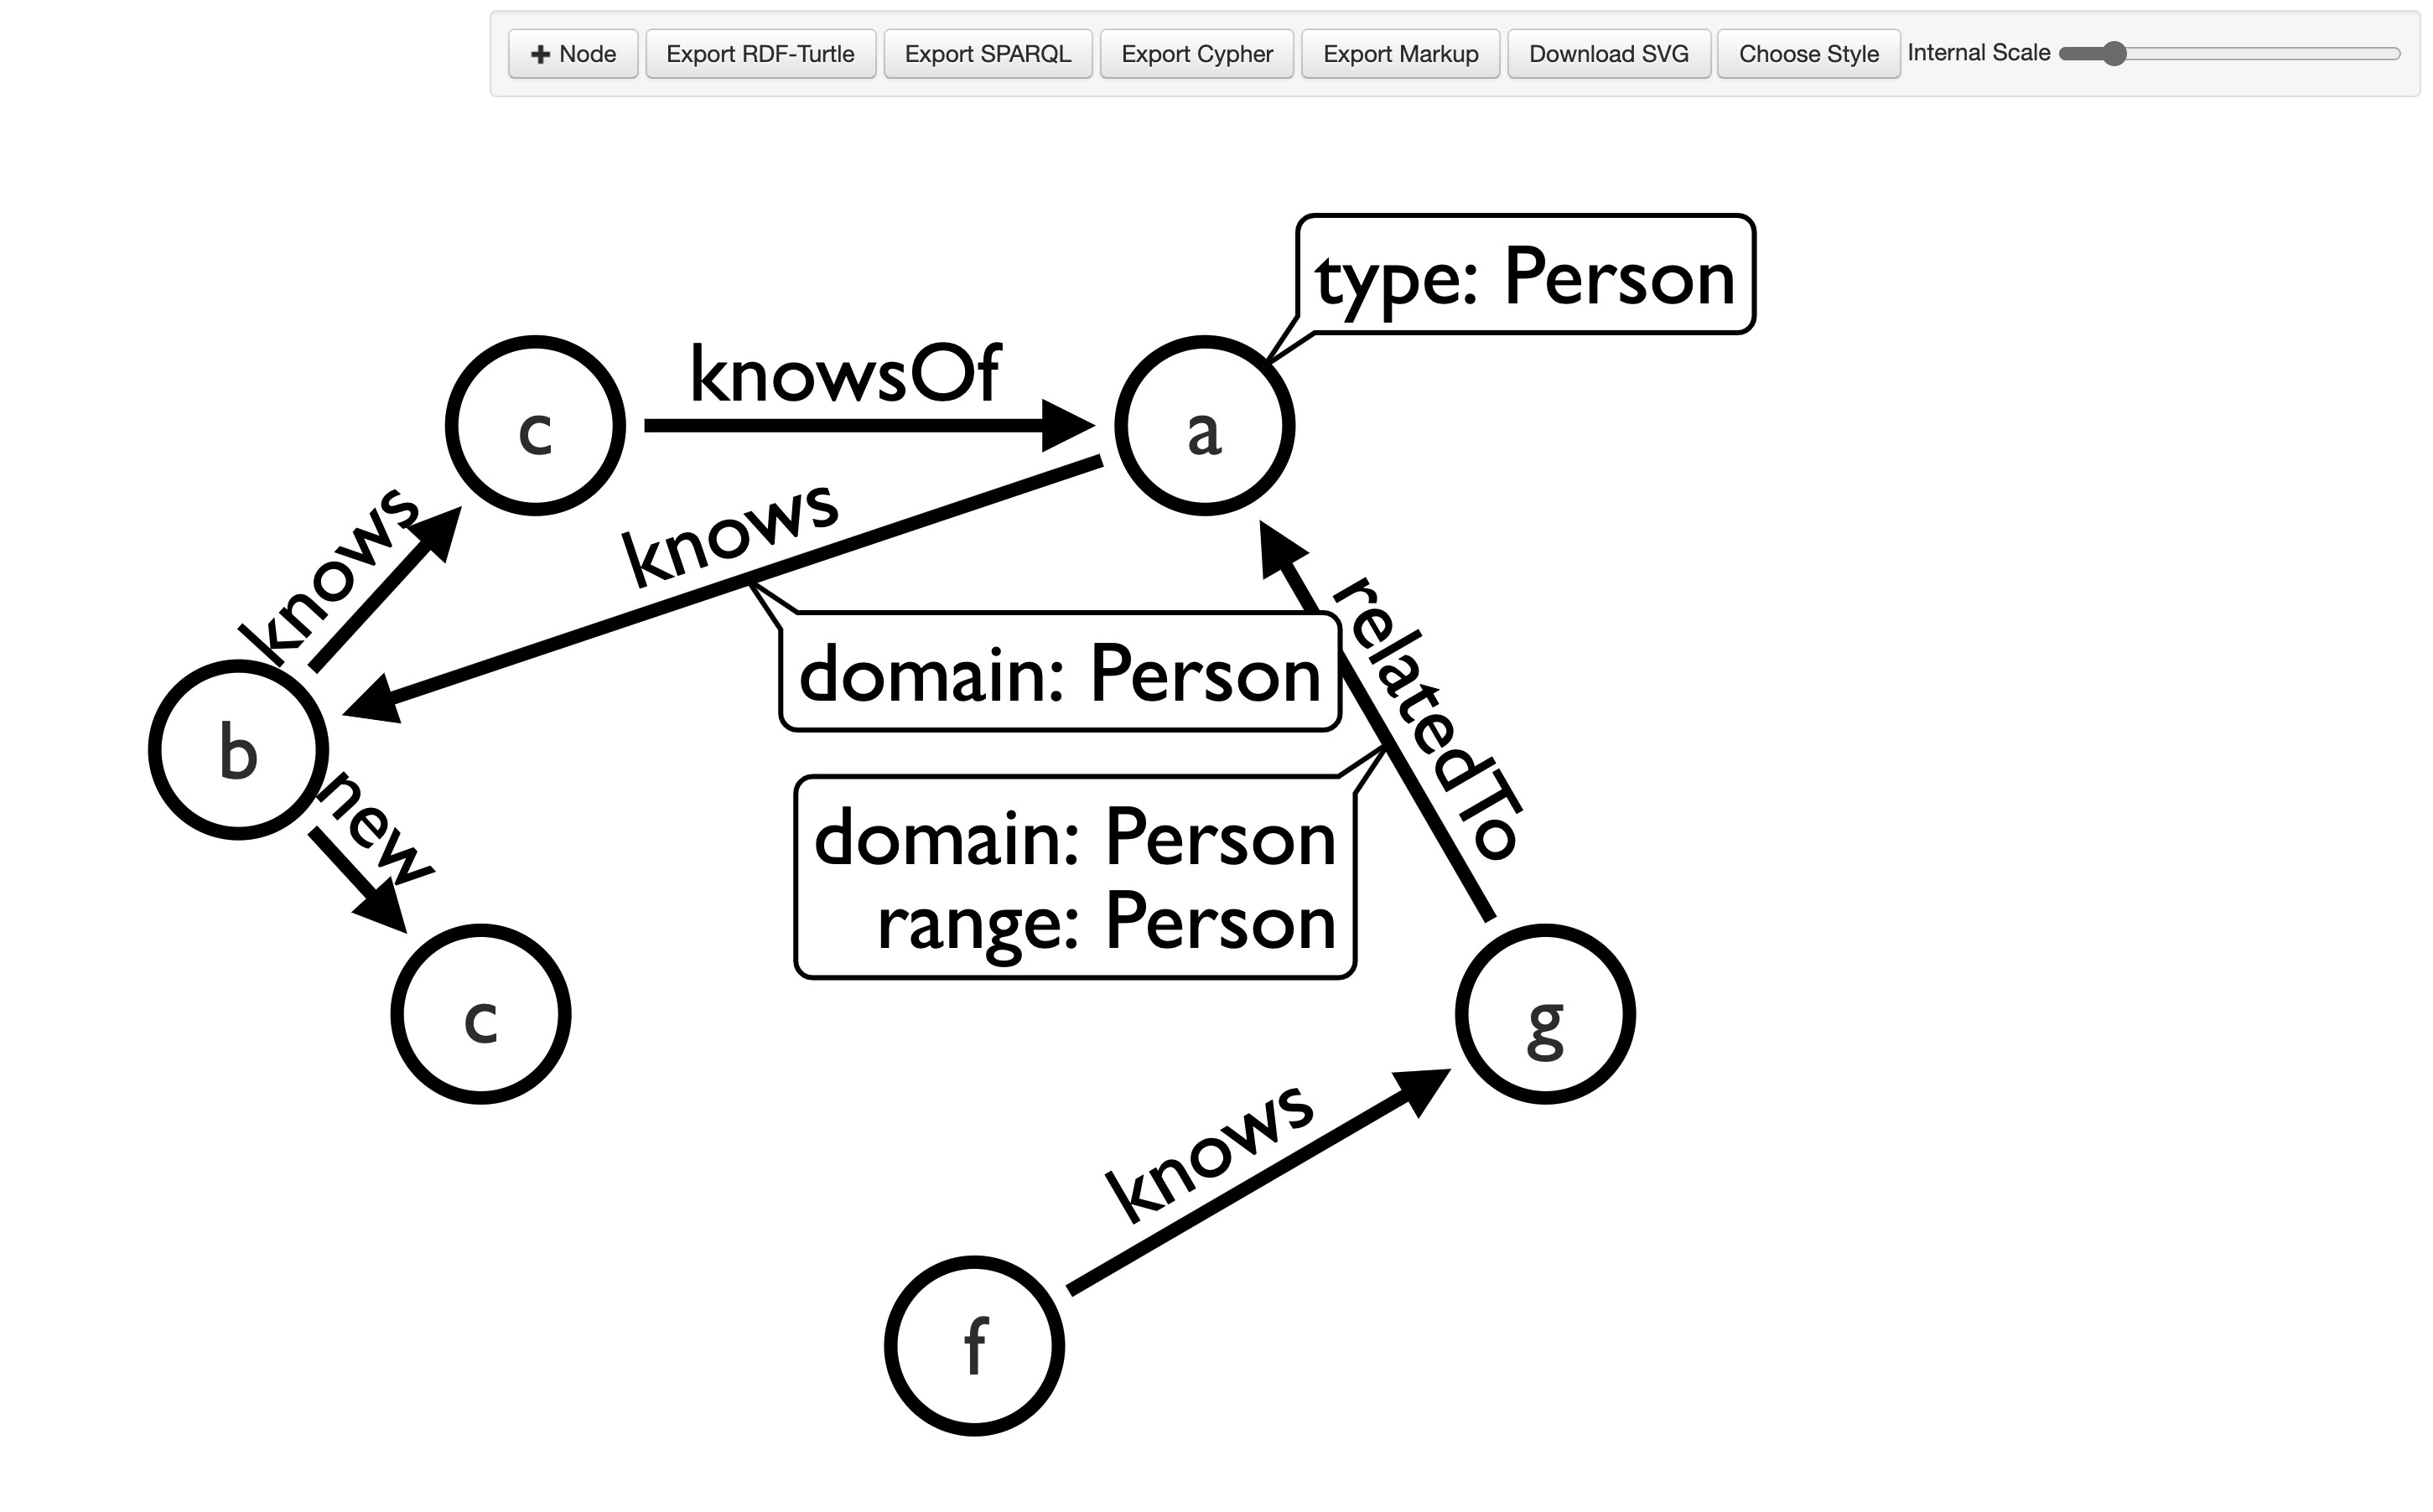
Please let me know if this is the kind of tool that you are looking for.
1 Like
Sir
I just want to use openlink virtuoso to create the graph data model. It should consist of 12 nodes having 2 property each. For an example Facebook. Can I make It using openlink virtuoso and export it to Neo4j and visualize the data model. Can you provide some guidance create the graph data model and export to Neo4j.
Hi @Menuka,
To clarify, when you mention creating a “graph data model”, are you referring to:
1. Creating data that can be loaded into Virtuoso
This can be done by hand, or using the Arrows fork previously mentioned.

2. Returning a query using a “graph data model” visualization
This can be done with Virtuoso + Neo4j using JDBC, or apoc.load.jsonParams

1 Like
Sir
I mean a graph database from graph data model.
should I have to write the database using sparql and upload it?
Can’t I create them using openlink virtuoso?
Sir how to add property in the tool Arrows fork it is not letting me to add?
I am creating a small database
So should I have to create a turtle file and upload it?
What are the steps I should perform inside it(after uploading )?
This is the requirement sir
Should create the graph database to represent social network. It should consist of 12 nodes having 2 property each.
Virtuoso is a Multi-Model DBMS which implies:
- Data organization using a variety Tuple structures e.g., 3-Tuples for RDF and N-Tuples for others
- Data interaction using a variety of query languages e.g., SQL, SPARQL, or SPASQL (fusion of SQL and SPARQL)
Based on the above, you can use Graph Visualization tools to produce Graph Pictorials of the data, all that’s required in a Visualization Tool that supports HTTP, ODBC, or JDBC.
You can upload data to Virtuoso using an RDF-Turtle doc, a CSV file, or even a JSON file if you want. The most important thing is to understand the Tuple Structure used for your Structured Data Representation.
The tool @danielhm shared with you is for creating Graphs compatible with RDF, SPARQL, or Cypher (the Neo4j Query Language) where each functions as a Data Definition Language (DDL).
Alternatively, if your data is already loaded into Virtuoso, or you plan to load a large dataset, you can simply visualize using a Graph Visualization Tool as I mentioned earlier.
Virtuoso doesn’t include a built-in Graph Data Visualization Tool, since it is a DBMS that offers data in formats usable by said tools.
Related
Sir
What should I do after loading the data?
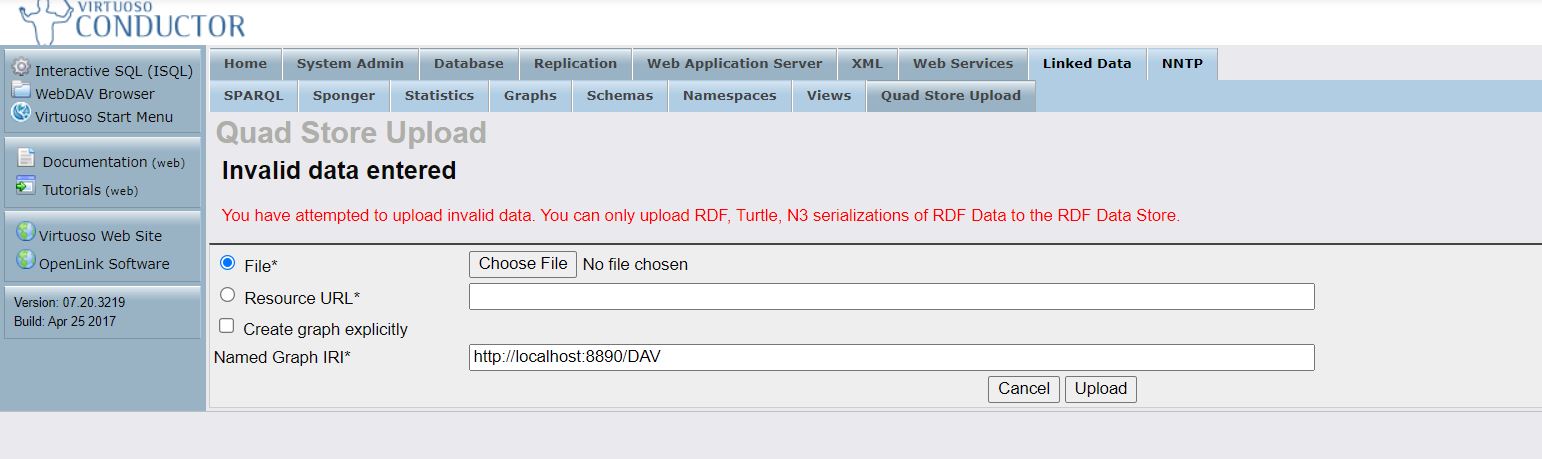
Where should I upload it? I’ve attached the error here. (I insert the JSON file. I was not able to create RDF-turtle or SPARQL from above mention tool).
The first tool doesn’t allow me to add properties and in the second tool I cannot get any
Sir can you can explain more what is the thing I should do inside the server. Based on the below points.
How to load data in virtuoso to create a graph database.
Steps I should perform inside the server to create the graph data model
How to export from the virtuoso to Neo4j.
Can you explain more about the statement ‘The most important thing is to understand the Tuple Structure used for your Structured Data Representation’
What is your fundamental goal here?
Are you trying to load RDF data (i.e., RDF-Turtle, RDF-XML, JSON-LD etc.) into Virtuoso? Or are you trying to load JSON?
JSON by itself doesn’t align with RDF, so you need transformation which is what’s provided by our Sponger Middleware (“Sponger”).
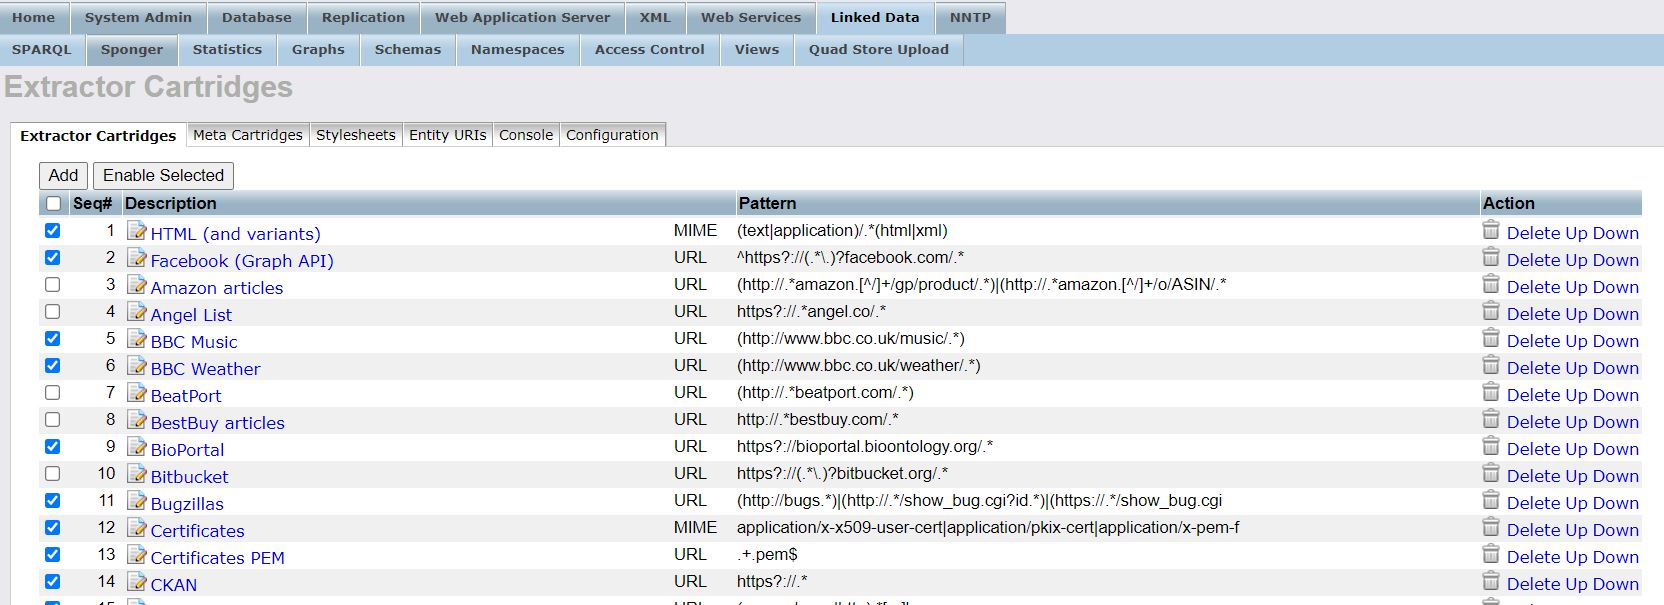
The Sponger is installed via a VAD package (cartridges_dav.vad). Once installed, you can then leverage it via SPARQL using specific pragmas (get:soft “soft”) or via a Web Service Endpoint (i.e., http://{cname}/about/html/{json-doc-url}). Note, you MUST configure the HTML Extractor Cartridge for this to function properly re JSON to RDF transformation.
You can also use our Structured Data Sniffer (OSDS) Browser Extension to achieve what’s outlined above, but with transformation happening on the client inside your browser i.e., JSON is converted to RDF which you can then upload to Virtuoso.
Related
Sir
The major requirement is to make the graph database with 10 nodes for facebook with 2 properties for each.
I tried it using the above mention tool. (Arrow Tool) I could create a .ttl file but it doesn’t let me export it. So that I used the other too (GitHub - apcj/arrows: JavaScript library for drawing diagrams of small graphs, using D3 to generate SVG. Useful for explaining Neo4j graph modelling concepts in presentations and blogs.) but I can only find a JSON file.
So I tried to upload It but I couldn’t.
And now I install the above-said package
I have come up to this point
Sir, I have this (OSDS) but how to create a set of RDF files using that.

What should I do next
Even though It is the extension is .ttl it is not letting me to upload
That tool includes an RDF-Turtle export option. You can copy an paste the exported content to a document.
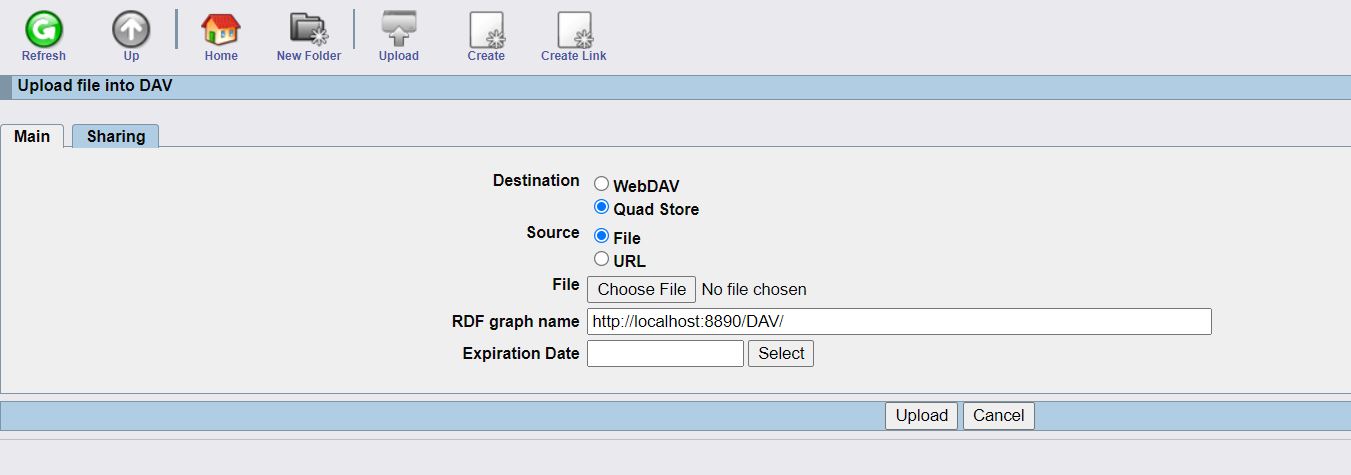
You then load the document into Virtuoso using the Sponger or via the Conductor Admin UI.
Let me know if this gets you past the basic “loading data from an RDF-Turtle document” into Virtuoso stage.
/cc @danielhm @hwilliams
Sir
I am using opensource edition with password user name dba and password dba
What sort of document I have to upload is text.
The sponger window I have attached below sir. In it where to upload sir.
I made a .ttl file using this website
http://www.visualdataweb.de/webvowl/ and I upload it to this place(picture attached below) the .tlt to this place but I didn’t get any response
Sir if you have youtube videos regarding this please attach them also.