A periodic usage report about the DBpedia SPARQL Query Service Endpoint and associated Linked Data Pages.
Copyright (C) 2021 OpenLink Software
Introduction
This document shows some of the statistics from the DBpedia 2016-10 dataset collected between July 2017 and January 2021; spanning more than three and a half year of logs from the DBpedia web service operated by OpenLink Software at http://dbpedia.org/sparql/ .
The log files used to prepare this document include data from the following DBpedia release:
Infrastructure
The DBpedia service consists of:
- two or more Virtuoso Universal Server Instances — facilitating Linked Data Deployment including providing a SPARQL endpoint delivering RDF data in a variety of document formats subject to content-negotiation.
- a Reverse Proxy Server — which redirects client requests to an available Virtuoso instance and caches the results in case another client repeats the same request within a specified timeframe
- a physical computer — hosted in OpenLink Software’s datacenter
Currently the DBpedia service is hosted on two virtual machines running CentOS 6, each using 8 Intel Xeon E5–2630 2.30 GHz cores with 200 GB SSD and 64GB memory, hosting Virtuoso 7.2 Enterprise Edition with the Column Store Module.
Rate and Connection limits
To maintain equitable access to the DBpedia service for everyone, OpenLink limits connections by rate and concurrent connection, limiting disruption by faulty or misbehaving applications.
Current limit rates are:
- Connection limit of 50 parallel connections per IP address . This number is fairly high to permit multiple clients in networks using Network Address Translation (NAT) to appear as one network IP. Without the use of tracking cookies, it is impossible to distinguish between machines inside a NAT network, and for privacy and legal reasons, OpenLink has decided not to use such cookies at this point in time.
- Rate limit of 100 requests per second per IP address, with an initial burst of 120 requests.
As part of monitoring the DBpedia service, OpenLink performs frequent traffic analysis to make sure the service is running smoothly.
Ideally, applications should be written to check the HTTP status code of each request, and in case of a 503 (Service Unavailable) or 429 (Too Many Requests) code, perform a 1–2 second sleep before retrying the request.
OpenLink may alter these parameters at any time to make sure the service remains reachable to the general public.
In case of misuse, OpenLink may temporarily block an offender’s IP address from accessing the DBpedia service. This temporary ban will be automatically lifted once such a blocked IP address refrains from making any request to the DBpedia service for at least 5 minutes.
Configured Virtuoso limits on the DBpedia endpoint
The Virtuoso configuration for the DBpedia endpoint includes:
- Query Execution Timeout of
120 seconds. This is the query solution preparation threshold. If the timeout stops execution before the solution is complete — i.e., if the solution is partial — this is indicated to the query client via HTTP response headers. - Maximum SPARQL query solution (aka result set) size of
10,000 rows. This is the maximum number of solution rows (forSELECTqueries) or triple/quad statements (forCONSTRUCTorDESCRIBEqueries) returned per query-solution-retrieval round-trip.
Virtuoso “Anytime Query” Functionality
The “Anytime Query” is a core feature of Virtuoso that enables it to handle the challenges inherent in providing a publicly accessible interface for ad-hoc querying at Web scale. This feature allows an application compliant with the SPARQL- and HTTP-protocol to issue long-running and/or large-solution queries, for which finding the complete solution would exceed configured query timeout and/or result set limits, and rather than being rebuffed with no solution, to receive partial solutions conforming to those thresholds. Further, this feature enables the use of LIMIT and OFFSET (typically combined with ORDER BY and/or GROUP BY) to create windows (also known as sliding windows or cursors ) to iterate through the complete query solution without being adversely affected by inserts or deletions.
Note: Even while paging through a partial query solution, Virtuoso continues to work towards a complete solution in the background.
Custom HTTP headers
As the W3C SPARQL standard currently does not specify an authoritative status code or header response to report a partial result set, OpenLink Software has opted to have Virtuoso return a status code of 200 to denote a successful request and add a custom header to the result to indicate that the result was limited to what could be returned within the settings enforced by the server.
If full execution of the query would return more than the configured maximum number of rows, the X-SPARQL-MaxRows line is added, as shown below:
HTTP/1.1 200 OK
Date: Tue, 1 Jan 2018 12:00:00 GMT
Content-Type: text/html; charset=UTF-8
Content-Length: 1427536
Connection: keep-alive
Vary: Accept-Encoding
Server: Virtuoso/07.20.3224 (Linux) i686-generic-linux-glibc212-64 VDB
X-SPARQL-default-graph: http://dbpedia.org
X-SPARQL-MaxRows: 10000
Expires: Tue, 07 Jan 2018 12:00:00 GMT
Cache-Control: max-age=604800
Access-Control-Allow-Origin: *
Access-Control-Allow-Credentials: true
Access-Control-Allow-Methods: HEAD, GET, POST, OPTIONS
Access-Control-Allow-Headers: DNT,X-CustomHeader,Keep-Alive,User-Agent,X-Requested-With,If-Modified-Since,Cache-Control,Content-Type,Accept-Encoding
Accept-Ranges: bytes
If the AnyTime Query timeout is reached, several headers are added:
HTTP/1.1 200 OK
Date: Tue, 01 Jan 2018 12:00:00 GMT
Content-Type: text/html; charset=UTF-8
Content-Length: 80
Connection: keep-alive
Server: Virtuoso/07.20.3224 (Linux) i686-generic-linux-glibc212-64 VDB
X-SPARQL-default-graph: http://dbpedia.org
X-SQL-State: S1TAT
X-SQL-Message: RC...: Returning incomplete results, query interrupted by result timeout. Activity: 7 rnd 64.87M seq 0 same seg 1 same pg 0 same par 0 disk 0 spec disk 0B / 0 mess
X-Exec-Milliseconds: 30000
X-Exec-DB-Activity: 7 rnd 64.87M seq 0 same seg 1 same pg 0 same par 0 disk 0 spec disk 0B / 0 messages 0 fork
Expires: Tue, 07 Jan 2018 12:00:00 GMT
Cache-Control: max-age=604800
Access-Control-Allow-Origin: *
Access-Control-Allow-Credentials: true
Access-Control-Allow-Methods: HEAD, GET, POST, OPTIONS
Access-Control-Allow-Headers: DNT,X-CustomHeader,Keep-Alive,User-Agent,X-Requested-With,If-Modified-Since,Cache-Control,Content-Type,Accept-Encoding
Accept-Ranges: bytes
Hosting Independent DBpedia Instances
The restrictions described above may impair some complex analytical queries. Users who frequently encounter these limits are advised to use one of the following methods:
- set up a private DBpedia instance in their own datacenter or in the cloud
- use a Docker image
- use an instance of OpenLink’s Pay-As-You-Go DBpedia AMIs (either the DBpedia 2016–10 Snapshot or the DBpedia-Live Mirror [starts from 2016–04 Snapshot]) on Amazon EC2.
HTTP logs
The HTTP server log files used in this report exclude traffic generated by:
- IP addresses that were temporarily rate-limited after their burst period
- IP addresses that were banned after misuse
- applications, spiders, and other crawlers that were blocked after frequently hitting the rate-limiter or which generally claimed too many resources
The system uses a combination of firewall rules and Access Control Lists (ACLs) to quickly drop such connections, so legitimate users of the DBpedia service can continue to connect and execute queries.
To save time, these dropped connections are not recorded in the log files.
The data for this document was extracted from reports generated by Webalizer v2.21.
HTTP Usage Historical Overview
The first table shows the average numbers of Visits and Hits per day during the time each DBpedia dataset was was live on the OpenLink Virtuoso SPARQL Query Editor endpoint.
| DBpedia | From | Until | Days | Visits per day | Hits per day | Total Hits |
|---|---|---|---|---|---|---|
| 3.3 | 2009-06-30 | 2009-11-05 | 128 | 9,602 | 733,811 | 94,661,592 |
| 3.4 | 2009-11-06 | 2010-04-07 | 152 | 11,100 | 1,212,549 | 185,519,930 |
| 3.5 | 2010-04-08 | 2011-01-17 | 284 | 16,381 | 1,122,612 | 282,898,279 |
| 3.6 | 2011-01-18 | 2011-06-30 | 163 | 19,288 | 1,328,355 | 219,178,587 |
| 3.7 | 2011-07-01 | 2012-06-19 | 354 | 23,408 | 2,052,660 | 594,338,675 |
| 3.8 | 2012-06-20 | 2013-09-19 | 456 | 16,614 | 2,925,335 | 570,440,410 |
| 3.9 | 2013-09-20 | 2014-09-02 | 347 | 22,026 | 3,035,428 | 1,062,399,840 |
| 2014 | 2014-09-03 | 2015-07-05 | 305 | 27,927 | 3,423,490 | 1,051,011,401 |
| 2015-04 | 2015-07-06 | 2016-03-31 | 269 | 24,689 | 3,516,936 | 953,089,788 |
| 2015-10 | 2016-04-01 | 2016-10-13 | 195 | 110,745 | 6,581,217 | 1,263,593,686 |
| 2016-04 | 2016-10-14 | 2017-07-03 | 262 | 231,735 | 7,646,447 | 2,003,369,014 |
| 2016-10 | 2017-07-04 | 2021-01-07 | 1283 | 257.994 | 7,542,623 | 9.501.427.081 |
Hits
The following graph shows the average number of hits (or requests) per day that were made to the DBpedia service across each release.
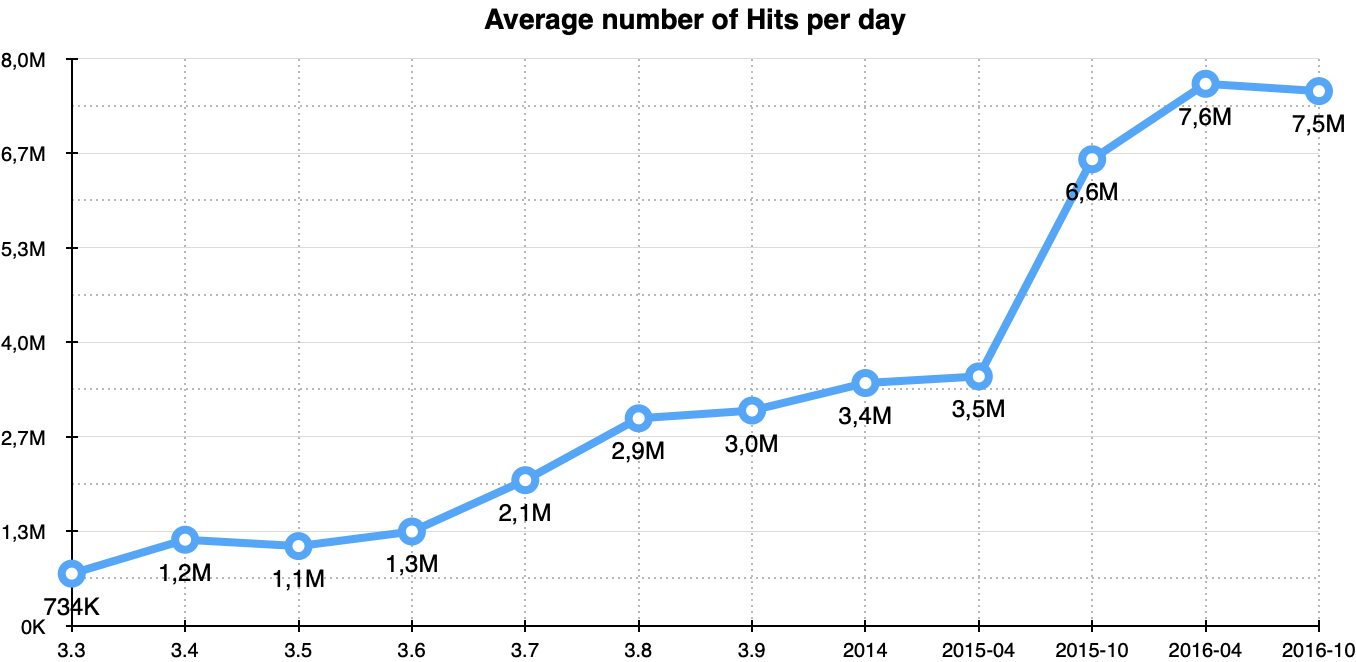
Coinciding with the DBpedia 2015–10 release on April 1 2016 there has been a dramatic increase in the number of Hits, which we attribute to the work in promoting DBpedia via the Community meetings as well as communication with various partners in the Linked Data community to increase back-links.
Visits
The following graph shows the average number of unique visits per day received during the periods associated with each DBpedia dataset.
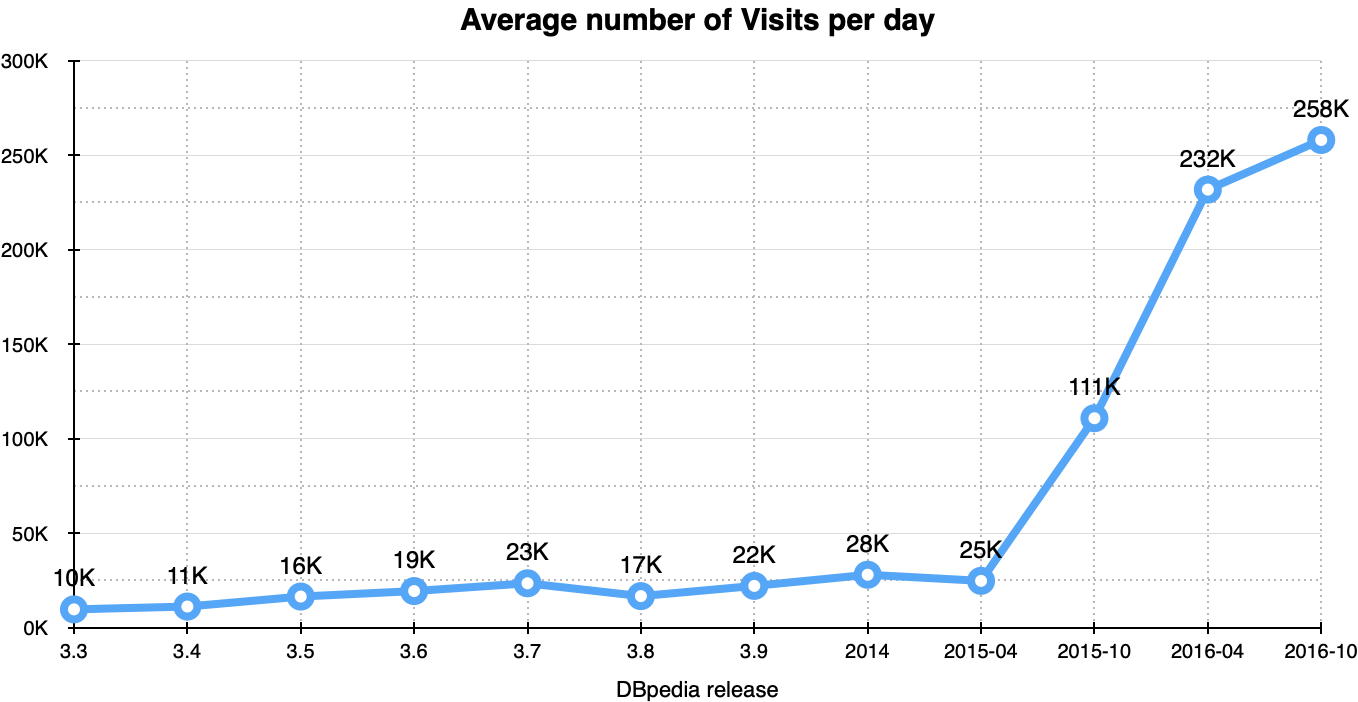
Similarly to the hits graph above we even more clearly see a huge increase in visits since the DBpedia 2015–10 release.
We consider multiple hits (or requests) by the same client with less than 30 minutes between two requests to comprise a single “visit”. A gap of more than 30 minutes between requests starts a second “visit”.
While web crawlers (like Google, DuckDuckGo, Bing, and Yahoo) normally do not make many distinct visits, projects hosted on Google’s UserContents, Amazon, and other cloud services do contribute to the number of visits.
OpenLink may analyze the visitor data from these various services separately in a future analytics document.
Linked Data Deployment
When talking about DBpedia, we normally refer to the SPARQL endpoint; however DBpedia offers also Linked Data Deployment via its /resource , /page , and /data endpoints as well as via applications like the OpenLink Faceted browser on /fct and /describe .
The next graph shows the percentage of the total number of hits in a given time period that can be attributed to the /sparql endpoint. If we look at the historical data from 2014–09 onward, we can see the requests to /sparql were about 60.16% of the total number of hits.
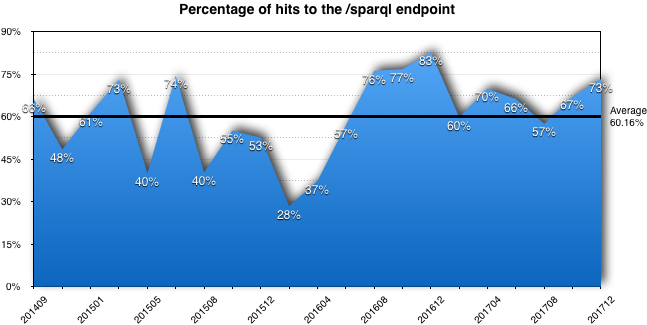
If we focus on the last 12 months, we can see a slightly lower average of 54%, as shown in the following graph:

This means that around 46% of traffic uses Linked Data constructions to view information available through DBpedia. To put this into perspective, that means that of the average of 7.5 million hits to the endpoint on a given day, around 3.5 million hits are Linked Data Deployment hits.
HTTP Usage Overview per month
The following table shows the information on sites visited and hits for
each month between 7 July 2017 and 7 January 2021.
| date | avg hits/day | avg visits/day | avg sites/day | total visits/month | total hits/month |
|---|---|---|---|---|---|
| Jul 17 | 5.578.398 | 218.240 | 4.521 | 6.328.970 | 161.773.561 |
| Aug 17 | 6.086.300 | 259.332 | 5.077 | 8.039.309 | 188.675.319 |
| Sep 17 | 6.947.742 | 352.603 | 5.470 | 10.578.109 | 208.432.279 |
| Oct 17 | 7.675.818 | 361.476 | 6.005 | 11.205.783 | 237.950.359 |
| Nov 17 | 9.194.890 | 357.392 | 6.779 | 10.721.776 | 275.846.718 |
| Dec 17 | 10.632.253 | 342.571 | 12.560 | 10.619.719 | 329.599.863 |
| Jan 18 | 10.577.535 | 316.331 | 7.815 | 9.806.275 | 327.903.592 |
| Feb 18 | 14.890.083 | 311.558 | 6.300 | 8.723.634 | 416.922.336 |
| Mar 18 | 7.975.823 | 259.410 | 5.490 | 8.041.731 | 247.250.543 |
| Apr 18 | 4.613.147 | 197.363 | 5.637 | 5.920.910 | 138.394.420 |
| May 18 | 6.126.606 | 208.519 | 5.021 | 6.464.117 | 189.924.812 |
| Jun 18 | 4.184.158 | 164.804 | 4.479 | 4.944.146 | 125.524.761 |
| Jul 18 | 8.202.696 | 256.854 | 6.240 | 7.962.494 | 254.283.601 |
| Aug 18 | 4.548.647 | 193.607 | 4.539 | 6.001.824 | 141.008.065 |
| Sep 18 | 5.426.150 | 190.524 | 5.224 | 5.715.735 | 162.784.511 |
| Oct 18 | 8.336.568 | 217.562 | 5.843 | 6.744.450 | 258.433.633 |
| Nov 18 | 8.088.759 | 209.250 | 6.526 | 6.277.501 | 242.662.799 |
| Dec 18 | 6.707.095 | 268.824 | 6.588 | 8.333.548 | 207.919.949 |
| Jan 19 | 8.764.751 | 259.233 | 6.990 | 8.036.241 | 271.707.300 |
| Feb 19 | 9.393.051 | 289.675 | 6.877 | 8.110.926 | 263.005.448 |
| Mar 19 | 8.761.301 | 292.466 | 7.760 | 9.066.473 | 271.600.335 |
| Apr 19 | 7.694.194 | 265.194 | 6.805 | 7.955.848 | 230.825.849 |
| May 19 | 7.939.766 | 270.442 | 6.588 | 8.383.727 | 246.132.759 |
| Jun 19 | 10.333.570 | 306.472 | 6.510 | 9.194.176 | 310.007.118 |
| Jul 19 | 9.460.654 | 342.808 | 6.932 | 10.627.065 | 293.280.303 |
| Aug 19 | 9.425.091 | 263.489 | 6.075 | 8.168.164 | 292.177.848 |
| Sep 19 | 7.837.989 | 230.720 | 7.348 | 6.921.614 | 235.139.683 |
| Oct 19 | 10.830.337 | 283.127 | 6.566 | 8.776.942 | 335.740.455 |
| Nov 19 | 6.426.288 | 212.631 | 7.876 | 6.378.934 | 192.788.645 |
| Dec 19 | 6.080.577 | 199.133 | 10.426 | 6.173.149 | 188.497.899 |
| Jan 20 | 4.287.020 | 171.482 | 18.216 | 5.315.968 | 132.897.632 |
| Feb 20 | 7.255.914 | 220.700 | 10.175 | 6.400.322 | 210.421.529 |
| Mar 20 | 6.665.140 | 297.540 | 9.187 | 9.223.766 | 206.619.369 |
| Apr 20 | 6.697.775 | 256.302 | 9.737 | 7.689.076 | 200.933.269 |
| May 20 | 5.424.694 | 317.421 | 7.566 | 9.840.080 | 168.165.516 |
| Jun 20 | 3.953.945 | 209.731 | 6.950 | 6.291.954 | 118.618.378 |
| Jul 20 | 4.295.223 | 236.908 | 7.173 | 7.344.157 | 133.151.920 |
| Aug 20 | 4.084.772 | 220.123 | 7.976 | 6.823.828 | 126.627.951 |
| Sep 20 | 5.182.890 | 215.275 | 8.960 | 6.458.273 | 155.486.717 |
| Oct 20 | 4.804.513 | 219.337 | 9.360 | 6.799.476 | 148.939.921 |
| Nov 20 | 5.142.495 | 232.282 | 9.106 | 6.968.473 | 154.274.862 |
| Dec 20 | 12.687.835 | 300.154 | 10.116 | 9.304.774 | 393.322.888 |
| Jan 21 | 15.110.338 | 294.864 | 12.537 | 2.064.052 | 105.772.366 |
| Sum | 330.747.489 | 9.501.427.081 | |||
| Average | 7.542.623 | 257.994 | 7.533 | 7.691.802 | 220.963.420 |
| Stdev | 2.716.172 | 52.634 | 2.570 | 1.840.423 | 75.038.026 |
| Median | 7.255.914 | 259.233 | 6.877 | 7.689.076 | 208.432.279 |
| Min | 3.953.945 | 164.804 | 4.479 | 2.064.052 | 105.772.366 |
| Max | 15.110.338 | 361.476 | 18.216 | 11.205.783 | 416.922.336 |
| Days | 1.283 | 1.283 |
Note: There is a bias when taking an average from a set of averages;
however, calculating the actual average as (sum of all hits) ÷ (number
of days in dataset) , or 9.501.427.081 ÷ 1283, we get 7,405,632
. Compared to the 7.542.623 average-of-averages from the table above,
this is a 1.8% difference, which we consider insignificant.
The table above is also available as a Google Sheet.
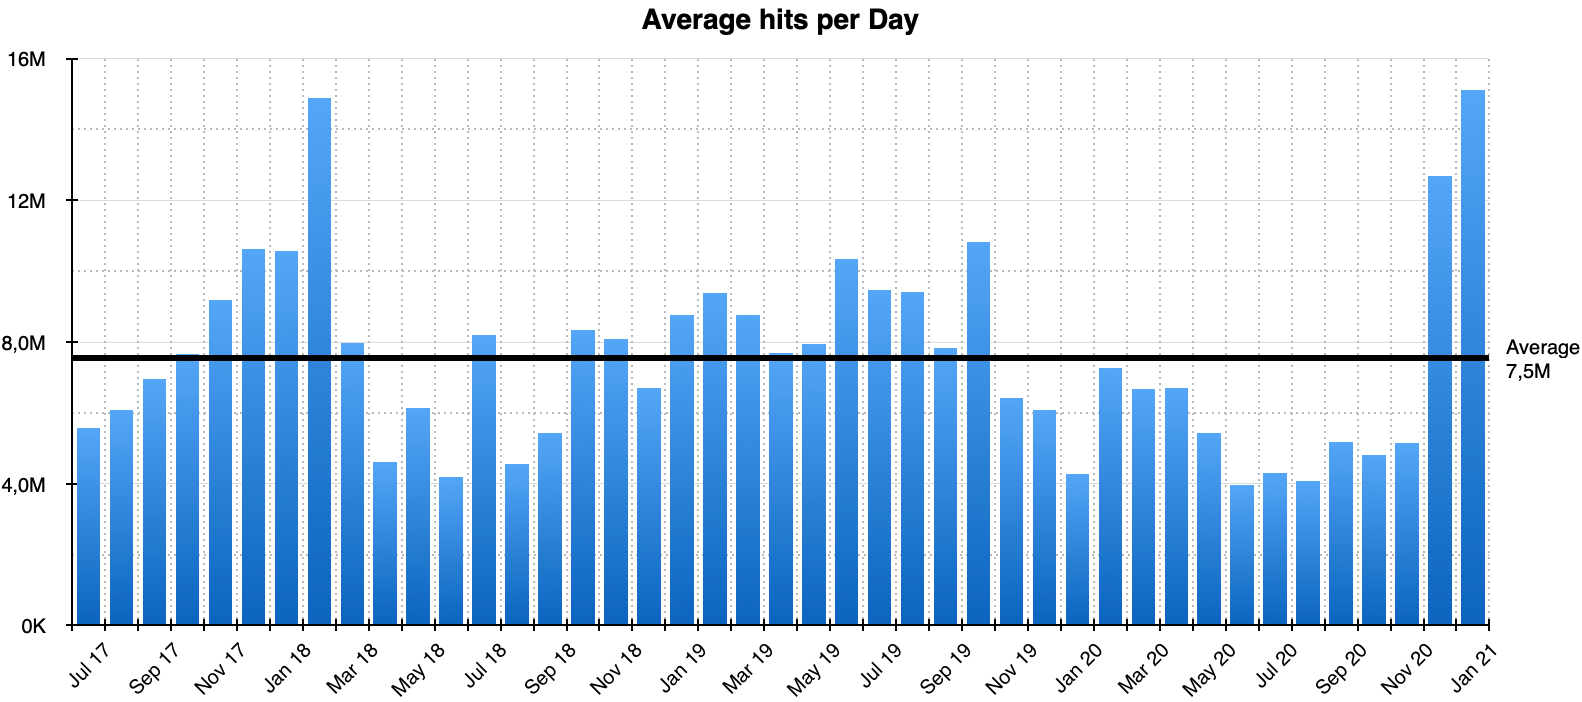
Hits
The following graph shows the average number of hits (or requests) per day for the whole time period:
The following graph shows the average number of hits (or requests) per day over the last year.

Visits
The following graph shows the average number of visits per day for the entire time period:
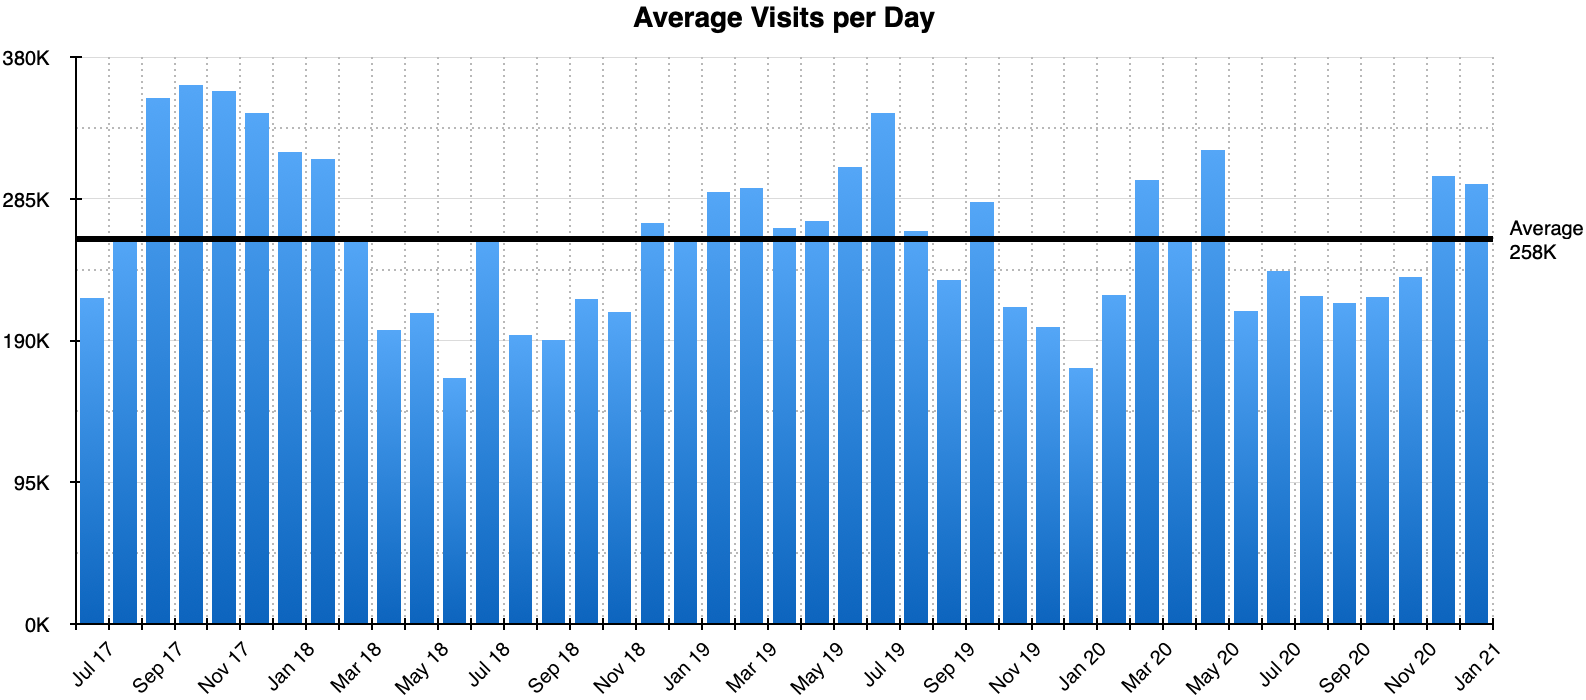
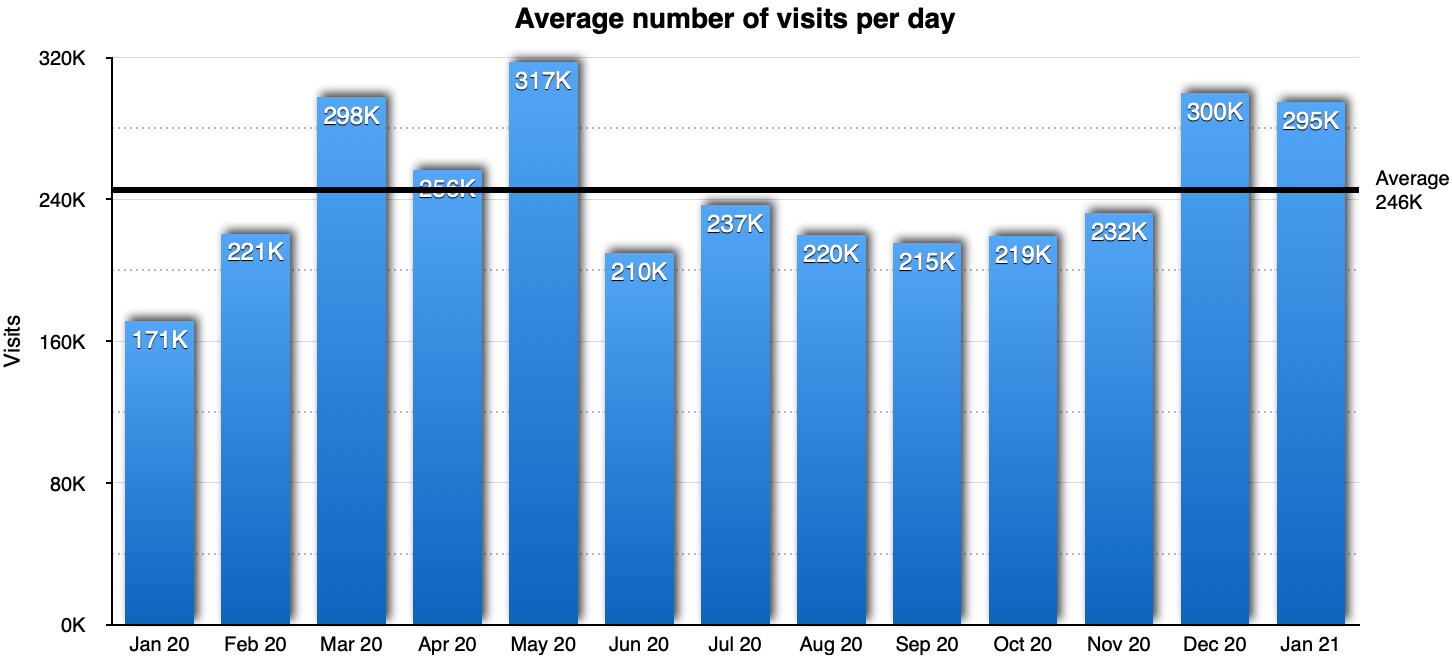
The following graph shows the average number of visits per day over the last year.
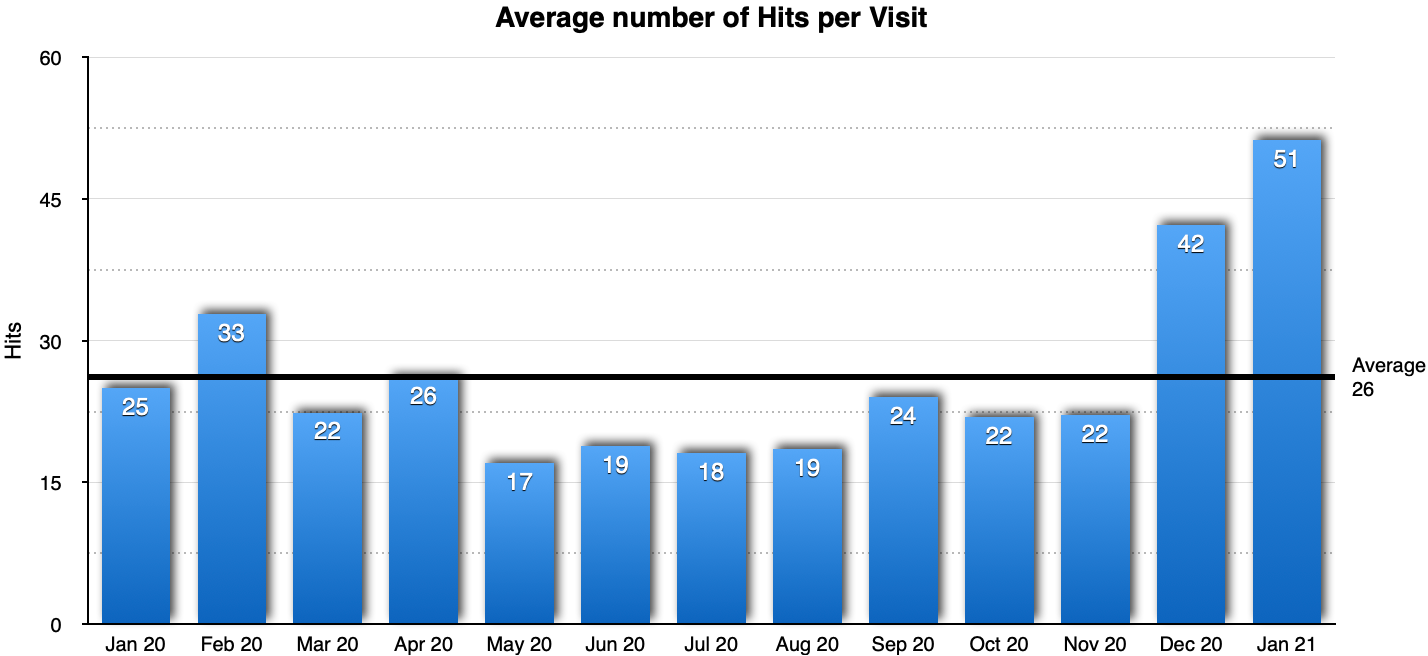
Average number of Hits per Visit
Dividing one by the other, we get hits per visit over the last year:
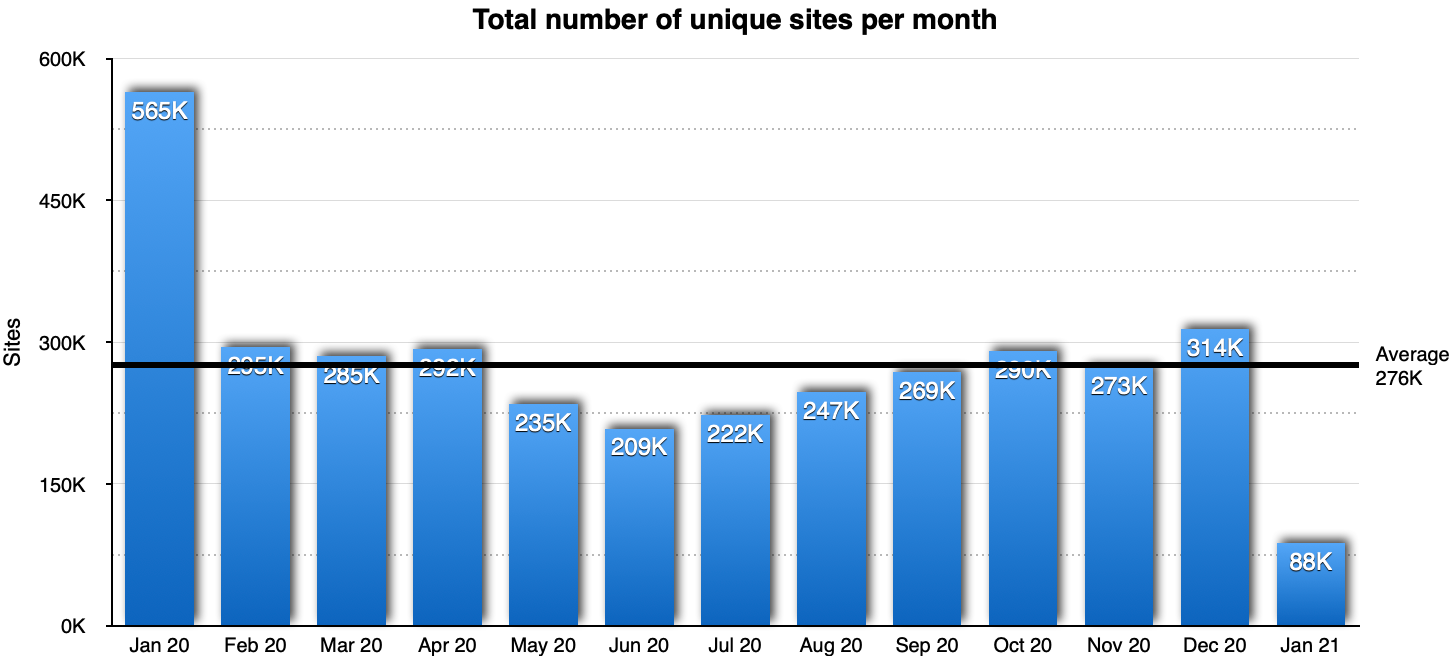
Sites
The last graph shows the number of unique IP addresses that made requests to the DBpedia service.
Related
- OpenLink Software
- DBpedia
- What is DBpedia, and why is it important?
- What is the Linked Open Data Cloud, and why is it important?
Previous Reports
Some of the statistics in this document were previously published as part of:
- DBpedia — A Large-scale, Multilingual Knowledge Base Extracted from Wikipedia by Jens Lehmann, Robert Isele, Max Jakob, Anja Jentzsch, Dimitris Kontokostas, Pablo N. Mendes, Sebastian Hellmann, Mohamed Morsey, Patrick van Kleef, Sören Auer, Christian Bizer.
- Data as of 2014–11–15 , published 2015–01–07 by OpenLink Software
- Data as of 2015–07–31 , published 2015–08–06 by OpenLink Software
- Data as of 2016–09–06 , published 2016–09–06 by OpenLink Software
- Data as of 2018-01-01, published on 2018-01-01 by OpenLink Software
- Data as of 2020-10-01, published on 2020-10-20 by OpenLink Software