Hi,
I have a question about Virtuoso’s memory usage increasing.
I am running a Virtuoso Server Community Edition - 07.20.3238-pthreads for Linux as of Sep 26 2023 (d89671fa1) - on Red Hat Enterprise Linux release 9.3 (Plow). The Linux server has 32 GB of memory and the Virtuoso server is the only service running on the Linux server.
However, even though NumberOfBuffers is set to 1360000 and MaxDirtyBuffers is set to1000000, the memory usage of the virtuoso-t process keeps increasing over time until the usage reaches 100% of 32GB, resulting in an unexpected DB crash at the end.
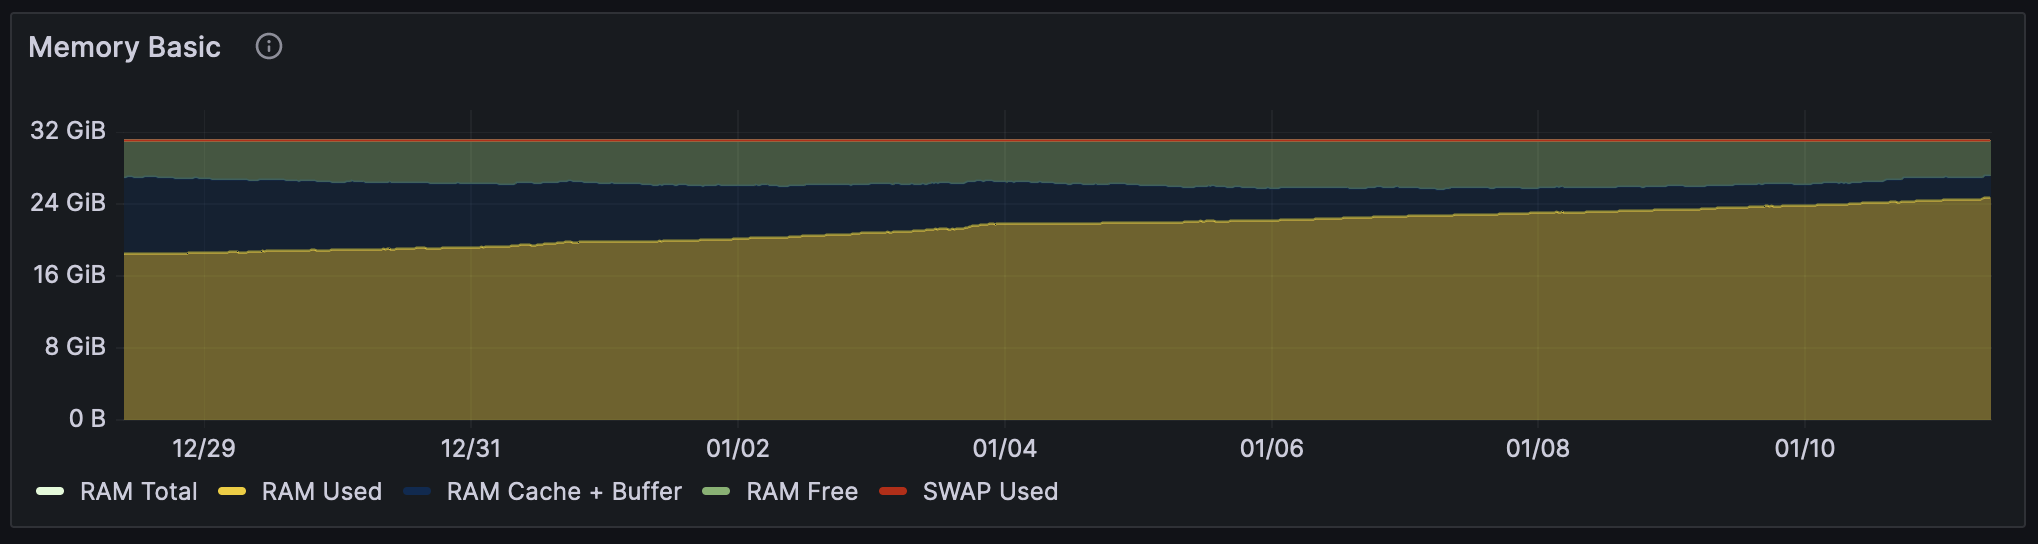
The screenshot below is the Linux server memory usage chart for the last 30 days(2023-12-09 ~ 2023-12-08).
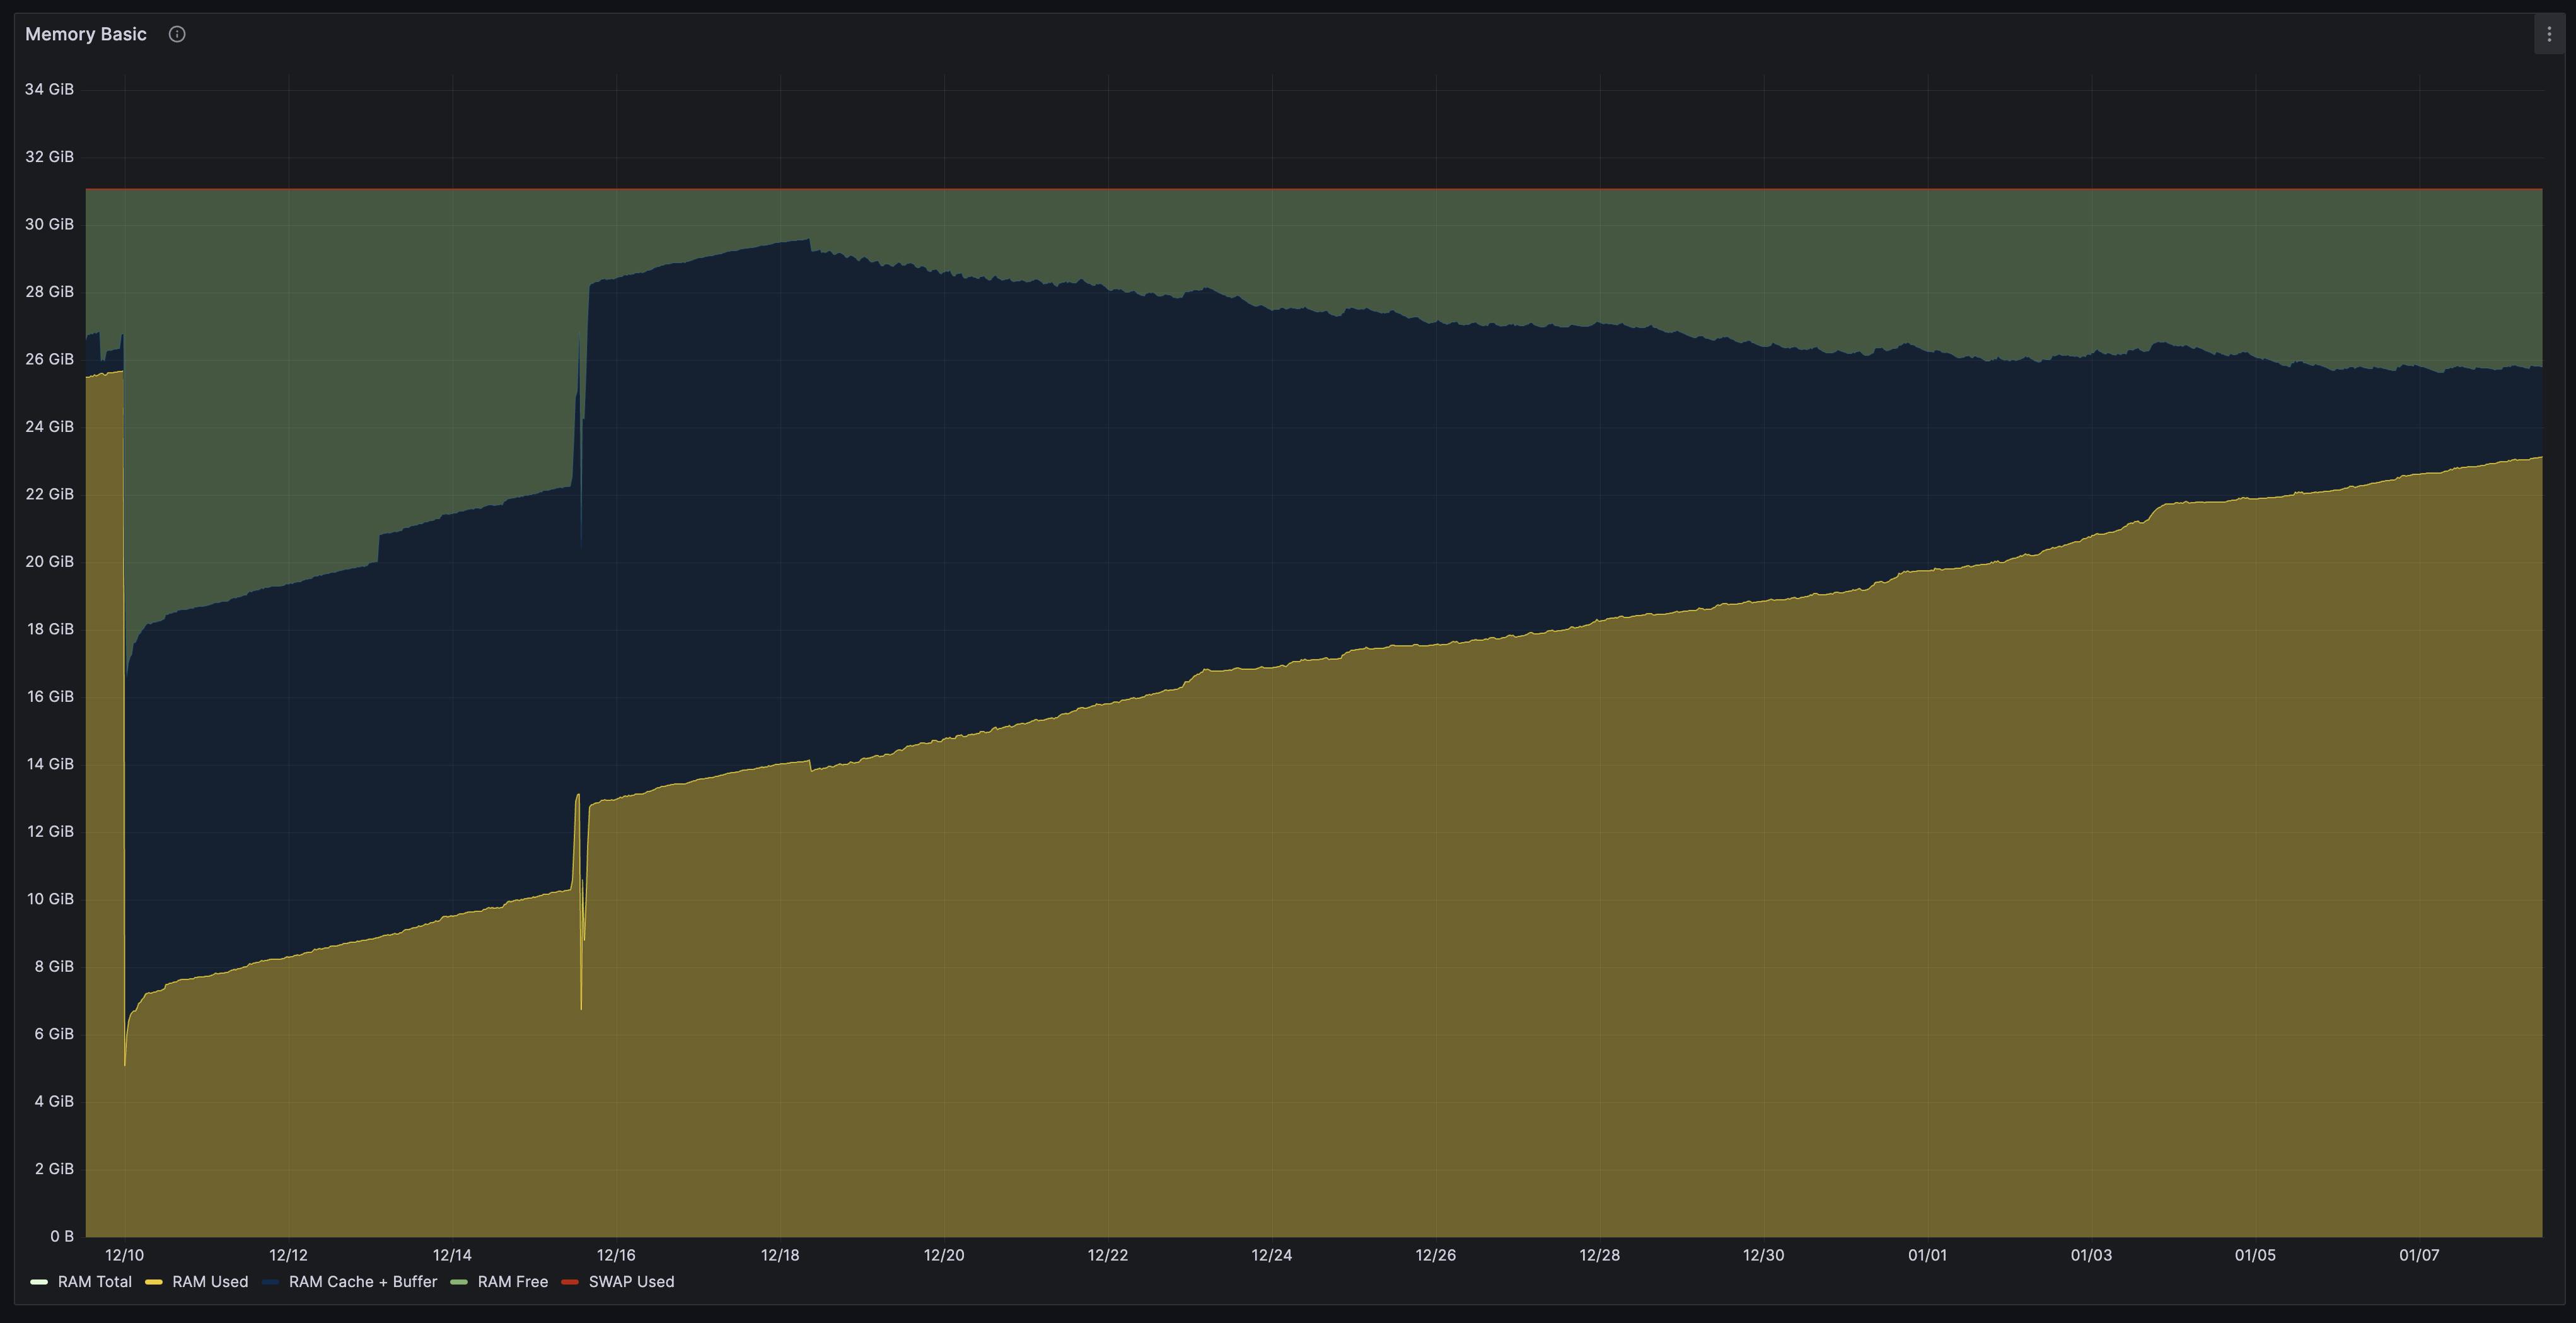
It clearly shows that the virtuoso-t process is using more than 23 GB of memory now and the usage is still increasing.
Because of this problem, I manually restart the virtuoso-t process each time just right before it reaches 100%.
I would like to ask how I can solve this problem so that I don’t have to manually restart the virtuoso-t process.
Here are more details of the status of the Virtuoso service running on the Linux server.
OS Version: Red Hat Enterprise Linux release 9.3 (Plow)
CPU: x86_64 - Intel(R) Xeon(R) Gold 6148 CPU @ 2.40GHz
MEM: 32 GB
Virtuoso Version: 07.20.3238-pthreads for Linux as of Sep 26 2023 (d89671fa1)
SQL> status();
REPORT
VARCHAR
_______________________________________________________________________________

OpenLink Virtuoso  Server
Version 07.20.3238-pthreads for Linux as of Sep 26 2023 (d89671fa1)
Started on: 2023-12-15 14:00 GMT+1
CPU: 0.00% RSS: 23072MB

Database Status:
  File size 268435456, 1081344 pages, 543084 free.
  1360000 buffers, 374536 used, 9986 dirty 0 wired down, repl age 79019338 0 w. io 0 w/crsr.
  Disk Usage: 368404 reads avg 0 msec, 0% r 0% w last  0 s, 5333370 writes flush      363.2 MB/s,
    2208 read ahead, batch = 158.  Autocompact 35209 in 26211 out, 25% saved col ac: 2326542 in 2% saved.
Gate:  13636 2nd in reads, 0 gate write waits, 0 in while read 0 busy scrap.
Log = /opt/database-prod/virtuoso.trx, 1848661 bytes
115112 pages have been changed since last backup (in checkpoint state)
Current backup prefix: prod-2023-12-15_#
Current backup timestamp: 0x903F-0x26-0xF6
Last backup date: Fri Dec 15 12:53:50 2023

Clients: 1 connects, max 1 concurrent
RPC: 4 calls, 1 pending, 1 max until now, 0 queued, 0 burst reads (0%), 0 second 0M large, 217M max
Checkpoint Remap 2000 pages, 0 mapped back. 66 s atomic time.
    DB master 1081344 total 543084 free 2000 remap 101 mapped back
   temp  1536 total 1531 free

Lock Status: 0 deadlocks of which 0 2r1w, 358 waits,
   Currently 1 threads running 0 threads waiting 0 threads in vdb.
Pending:
  20284: IER INTERNAL
  23629: IER INTERNAL

Client 1111:1:  Account: dba, 203 bytes in, 286 bytes out, 1 stmts.
PID: 1990987, OS: unix, Application: unknown, IP#: 127.0.0.1
Transaction status: PENDING, 1 threads.
Locks:


Running Statements:
 Time (msec) Text
          33 status()


Hash indexes


42 Rows. -- 34 msec.
SQL> status('rhck');
REPORT
VARCHAR
_______________________________________________________________________________

OpenLink Virtuoso  Server
Version 07.20.3238-pthreads for Linux as of Sep 26 2023 (d89671fa1)
Started on: 2023-12-15 14:00 GMT+1
CPU: 0.37% RSS: 23072MB

Database Status:
  File size 268435456, 1081344 pages, 543084 free.
  1360000 buffers, 374536 used, 9986 dirty 0 wired down, repl age 79019338 0 w. io 0 w/crsr.
  Disk Usage: 368404 reads avg 0 msec, 0% r 0% w last  10 s, 5333370 writes flush      363.2 MB/s,
    2208 read ahead, batch = 158.  Autocompact 35209 in 26211 out, 25% saved col ac: 2326542 in 2% saved.
Gate:  13636 2nd in reads, 0 gate write waits, 0 in while read 0 busy scrap.
Log = /opt/database-prod/virtuoso.trx, 1848661 bytes
115112 pages have been changed since last backup (in checkpoint state)
Current backup prefix: prod-2023-12-15_#
Current backup timestamp: 0x903F-0x26-0xF6
Last backup date: Fri Dec 15 12:53:50 2023

Clients: 1 connects, max 1 concurrent
RPC: 6 calls, 1 pending, 1 max until now, 0 queued, 0 burst reads (0%), 0 second 0M large, 217M max
Checkpoint Remap 2000 pages, 0 mapped back. 66 s atomic time.
    DB master 1081344 total 543084 free 2000 remap 101 mapped back
   temp  1536 total 1531 free

Lock Status: 0 deadlocks of which 0 2r1w, 358 waits,
   Currently 1 threads running 0 threads waiting 0 threads in vdb.
Pending:

Client 1111:1:  Account: dba, 322 bytes in, 2784 bytes out, 1 stmts.
PID: 1990987, OS: unix, Application: unknown, IP#: 127.0.0.1
Transaction status: PENDING, 1 threads.
Locks:


Running Statements:
 Time (msec) Text
          20 status('rhck')
Index Usage:
Table         Index            Touches   Reads %Miss   Locks   Waits   %W n-dead
WS.WS.SYS_DAV_QUEUE SYS_DAV_QUEUE         13760       1    0%   34400       0   0% 0
WS.WS.SYS_DAV_QUEUE SYS_DAV_QUEUE_STATE   13760       1    0%   20640       0   0% 0
WS.WS.SYS_DAV_QUEUE_LCK SYS_DAV_QUEUE_LCK     10321       1    0%   30960       0   0% 0
VAD.DBA.VAD_REGISTRY VAD_REGISTRY            508       8    1%       0       0   0% 0
VAD.DBA.VAD_REGISTRY VAD_REGISTRY_CHDIR      926       3    0%       0       0   0% 0
VAD.DBA.VAD_REGISTRY VAD_REGISTRY_KEY        736       4    0%       0       0   0% 0
VAD.DBA.VAD_HELP   VAD_HELP                 46       1    2%      46       0   0% 0
PUMP.DBA.DBPUMP_HELP DBPUMP_HELP              88       1    1%       0       0   0% 0
DB.DBA.RDF_PREFIX  RDF_PREFIX               11       1    8%       0       0   0% 0
DB.DBA.RDF_PREFIX  DB_DBA_RDF_PREFIX_UNQC_RP_ID     375       1    0%       0       0   0% 0
DB.DBA.RDF_IRI     RDF_IRI              328171   68948   21%  653594       4   0% 0
DB.DBA.RDF_IRI     DB_DBA_RDF_IRI_UNQC_RI_ID 5980927105   56832    0%  388015       0   0% 0
DB.DBA.RDF_QUAD    RDF_QUAD            153833070824   31492    0% 1668368       0   0% 0
DB.DBA.RDF_QUAD    RDF_QUAD_SP         3925231    6530    0%  328336     334   0% 0
DB.DBA.RDF_QUAD    RDF_QUAD_POGS       1734475962   19859    0% 1726539       0   0% 0
DB.DBA.RDF_QUAD    RDF_QUAD_GS          327716     293    0%  322359       0   0% 0
DB.DBA.RDF_QUAD    RDF_QUAD_OP          309587    6377    2%  301044       0   0% 0
DB.DBA.RDF_OBJ     RDF_OBJ             4744326404   28450    0%   17949       0   0% 0
DB.DBA.RDF_OBJ     RO_VAL               335497   38176   11%   13273      20   0% 0
DB.DBA.RO_START    RO_START              13273   17482  131%   13273       0   0% 0
DB.DBA.RDF_DATATYPE RDF_DATATYPE        53862815       1    0%       0       0   0% 0
DB.DBA.RDF_DATATYPE DB_DBA_RDF_DATATYPE_UNQC_RDT_TWOBYTE 53862689       1    0%       0       0   0% 0
DB.DBA.RDF_LANGUAGE DB_DBA_RDF_LANGUAGE_UNQC_RL_TWOBYTE     598       1    0%       0       0   0% 0
DB.DBA.RDF_OBJ_FT_RULES RDF_OBJ_FT_RULES          1       1   50%       0       0   0% 0
DB.DBA.RDF_OBJ_RO_FLAGS_WORDS RDF_OBJ_RO_FLAGS_WORDS   33355   89610  268%   73513       0   0% 0
DB.DBA.VTLOG_DB_DBA_RDF_OBJ VTLOG_DB_DBA_RDF_OBJ   68374       1    0%   57472       0   0% 0
DB.DBA.RDF_GRAPH_GROUP RDF_GRAPH_GROUP_IRI       4       1   20%       0       0   0% 0
DB.DBA.RDF_GRAPH_USER RDF_GRAPH_USER           10       1    9%       5       0   0% 0
DB.DBA.RDF_GRAPH_USER RDF_GRAPH_USER_USER_ID       4       1   20%       0       0   0% 0
DB.DBA.LDLOCK      LDLOCK                    1       1   50%       0       0   0% 0
WS.WS.SYS_DAV_RES  SYS_DAV_RES              19      91  455%       0       0   0% 0
WS.WS.SYS_DAV_RES  SYS_DAV_RES_FULL_PATH      14       4   26%       0       0   0% 0
WS.WS.SYS_DAV_PROP SYS_DAV_PROP_ID           2       1   33%       0       0   0% 0
WS.WS.SYS_DAV_RES_TYPES SYS_DAV_RES_TYPES       914       4    0%      10       0   0% 0
DB.DBA.HTTP_PATH   HTTP_PATH               176       1    0%      11       0   0% 0
DB.DBA.HTTP_PATH_DEFAULT HTTP_PATH_DEFAULT         2       1   33%       2       0   0% 0


Hash indexes


78 Rows. -- 21 msec.
And the below is the configuration of the current running service.
;
;  Database setup
;
[Database]
DatabaseFile       = /opt/database-prod/virtuoso.db
ErrorLogFile       = /opt/database-prod/virtuoso.log
LockFile           = /opt/database-prod/virtuoso.lck
TransactionFile    = /opt/database-prod/virtuoso.trx
xa_persistent_file = /opt/database-prod/virtuoso.pxa
ErrorLogLevel      = 7
FileExtend         = 200
MaxCheckpointRemap = 2000
Striping           = 0
TempStorage        = TempDatabase

[TempDatabase]
DatabaseFile       = /opt/database-prod/virtuoso-temp.db
TransactionFile    = /opt/database-prod/virtuoso-temp.trx
MaxCheckpointRemap = 2000
Striping           = 0

;
;  Server parameters
;
[Parameters]
ServerPort               = 1111
LiteMode                 = 0
DisableUnixSocket        = 1
DisableTcpSocket         = 0
TempDBSize               = 0
MaxClientConnections     = 20
CheckpointInterval       = 60
O_DIRECT                 = 1
CaseMode                 = 2
MaxStaticCursorRows      = 5000
AllowOSCalls             = 0
SchedulerInterval        = 10
DirsAllowed              = ., /opt/virtuoso-opensource/vad
ThreadCleanupInterval    = 1
ThreadThreshold          = 4
ResourcesCleanupInterval = 1
FreeTextBatchSize        = 100000
SingleCPU                = 0
VADInstallDir            = /opt/virtuoso-opensource/vad/
PrefixResultNames        = 0
RdfFreeTextRulesSize     = 1000
IndexTreeMaps            = 256
MaxMemPoolSize           = 200000000
PrefixResultNames        = 0
MacSpotlight             = 0
MaxQueryMem              = 8G   ; memory allocated to query processor
VectorSize               = 1000 ; initial parallel query vector (array of query operations) size
MaxVectorSize            = 1000000      ; query vector size threshold.
AdjustVectorSize         = 0
ThreadsPerQuery          = 2
AsyncQueueMaxThreads     = 4
CheckpointAuditTrail     = 0
AutoCheckpointLogSize    = 10485760

; Uncomment next two lines if there is 16 GB system memory free
NumberOfBuffers          = 1360000
MaxDirtyBuffers          = 1000000

[HTTPServer]
ServerPort                  = 7000
ServerRoot                  = /opt/virtuoso-opensource/vsp
MaxClientConnections        = 20
DavRoot                     = DAV
EnabledDavVSP               = 0
HTTPProxyEnabled            = 0
TempASPXDir                 = 0
DefaultMailServer           = localhost:25
MaxKeepAlives               = 10
KeepAliveTimeout            = 10
MaxCachedProxyConnections   = 10
ProxyConnectionCacheTimeout = 15
HTTPThreadSize              = 280000
HttpPrintWarningsInOutput   = 0
Charset                     = UTF-8
MaintenancePage             = atomic.html
EnabledGzipContent          = 1

[AutoRepair]
BadParentLinks = 0

[Client]
SQL_PREFETCH_ROWS  = 100
SQL_PREFETCH_BYTES = 16000
SQL_QUERY_TIMEOUT  = 0
SQL_TXN_TIMEOUT    = 0

[VDB]
ArrayOptimization           = 0
NumArrayParameters          = 10
VDBDisconnectTimeout        = 1000
KeepConnectionOnFixedThread = 0

[Replication]
ServerName   = db-CENTOS5-PORT
ServerEnable = 1
QueueMax     = 50000

[Zero Config]
ServerName = virtuoso (CENTOS5-PORT)

[URIQA]
DynamicLocal = 0
DefaultHost  = localhost:7000

[SPARQL]
ExternalQuerySource             = 0
ExternalXsltSource              = 0
ResultSetMaxRows        = 500000
DefaultQuery            = select distinct ?Concept where {[] a ?Concept} LIMIT 100
DeferInferenceRulesInit = 0     ; controls inference rules loading
MaxMemInUse             = 0     ; limits the amount of memory for construct dict (0=unlimited)

[Plugins]
LoadPath = /opt/virtuoso-opensource/hosting