Along with the rest of the world, we have been anxiously following the development of the virus COVID-19 (aka coronavirus).
Crucial to fighting against this disease is the need to harness the power of Data (Measurements), Information (Metrics), and Knowledge (Insights) via open data access oriented infrastructure such as what’s provided by the Linked Open Data (LOD) Cloud – the world’s largest Knowledge Graph comprising massive enclaves associated with BioInformatics, Genomics, Life Sciences, Biology, Molecular Biology, Chemistry etc…
Contributing to the LOD Cloud is immensely simplified when data is published in Open Data form using standard document types such as CSV or JSON which are easily transformed into 5-Star Linked Data using the kind of Extract, Load, and Transform Middleware provided by our URIBurner Service (a live instance of Virtuoso with the Sponger Module enabled).
Generating Linked Data from Open Data
Johns Hopkins University’s Center for Systems Science and Engineering provides a great
COVID19 Tracking Project on Github that offers Data in CSV format for tracking the outbreak globally.
As a result, courtesy of our Virtuoso RDBMS instance behind our public service, we can formulate a hyperlink that transforms the CSV Structured Data into a Knowledge Graph.
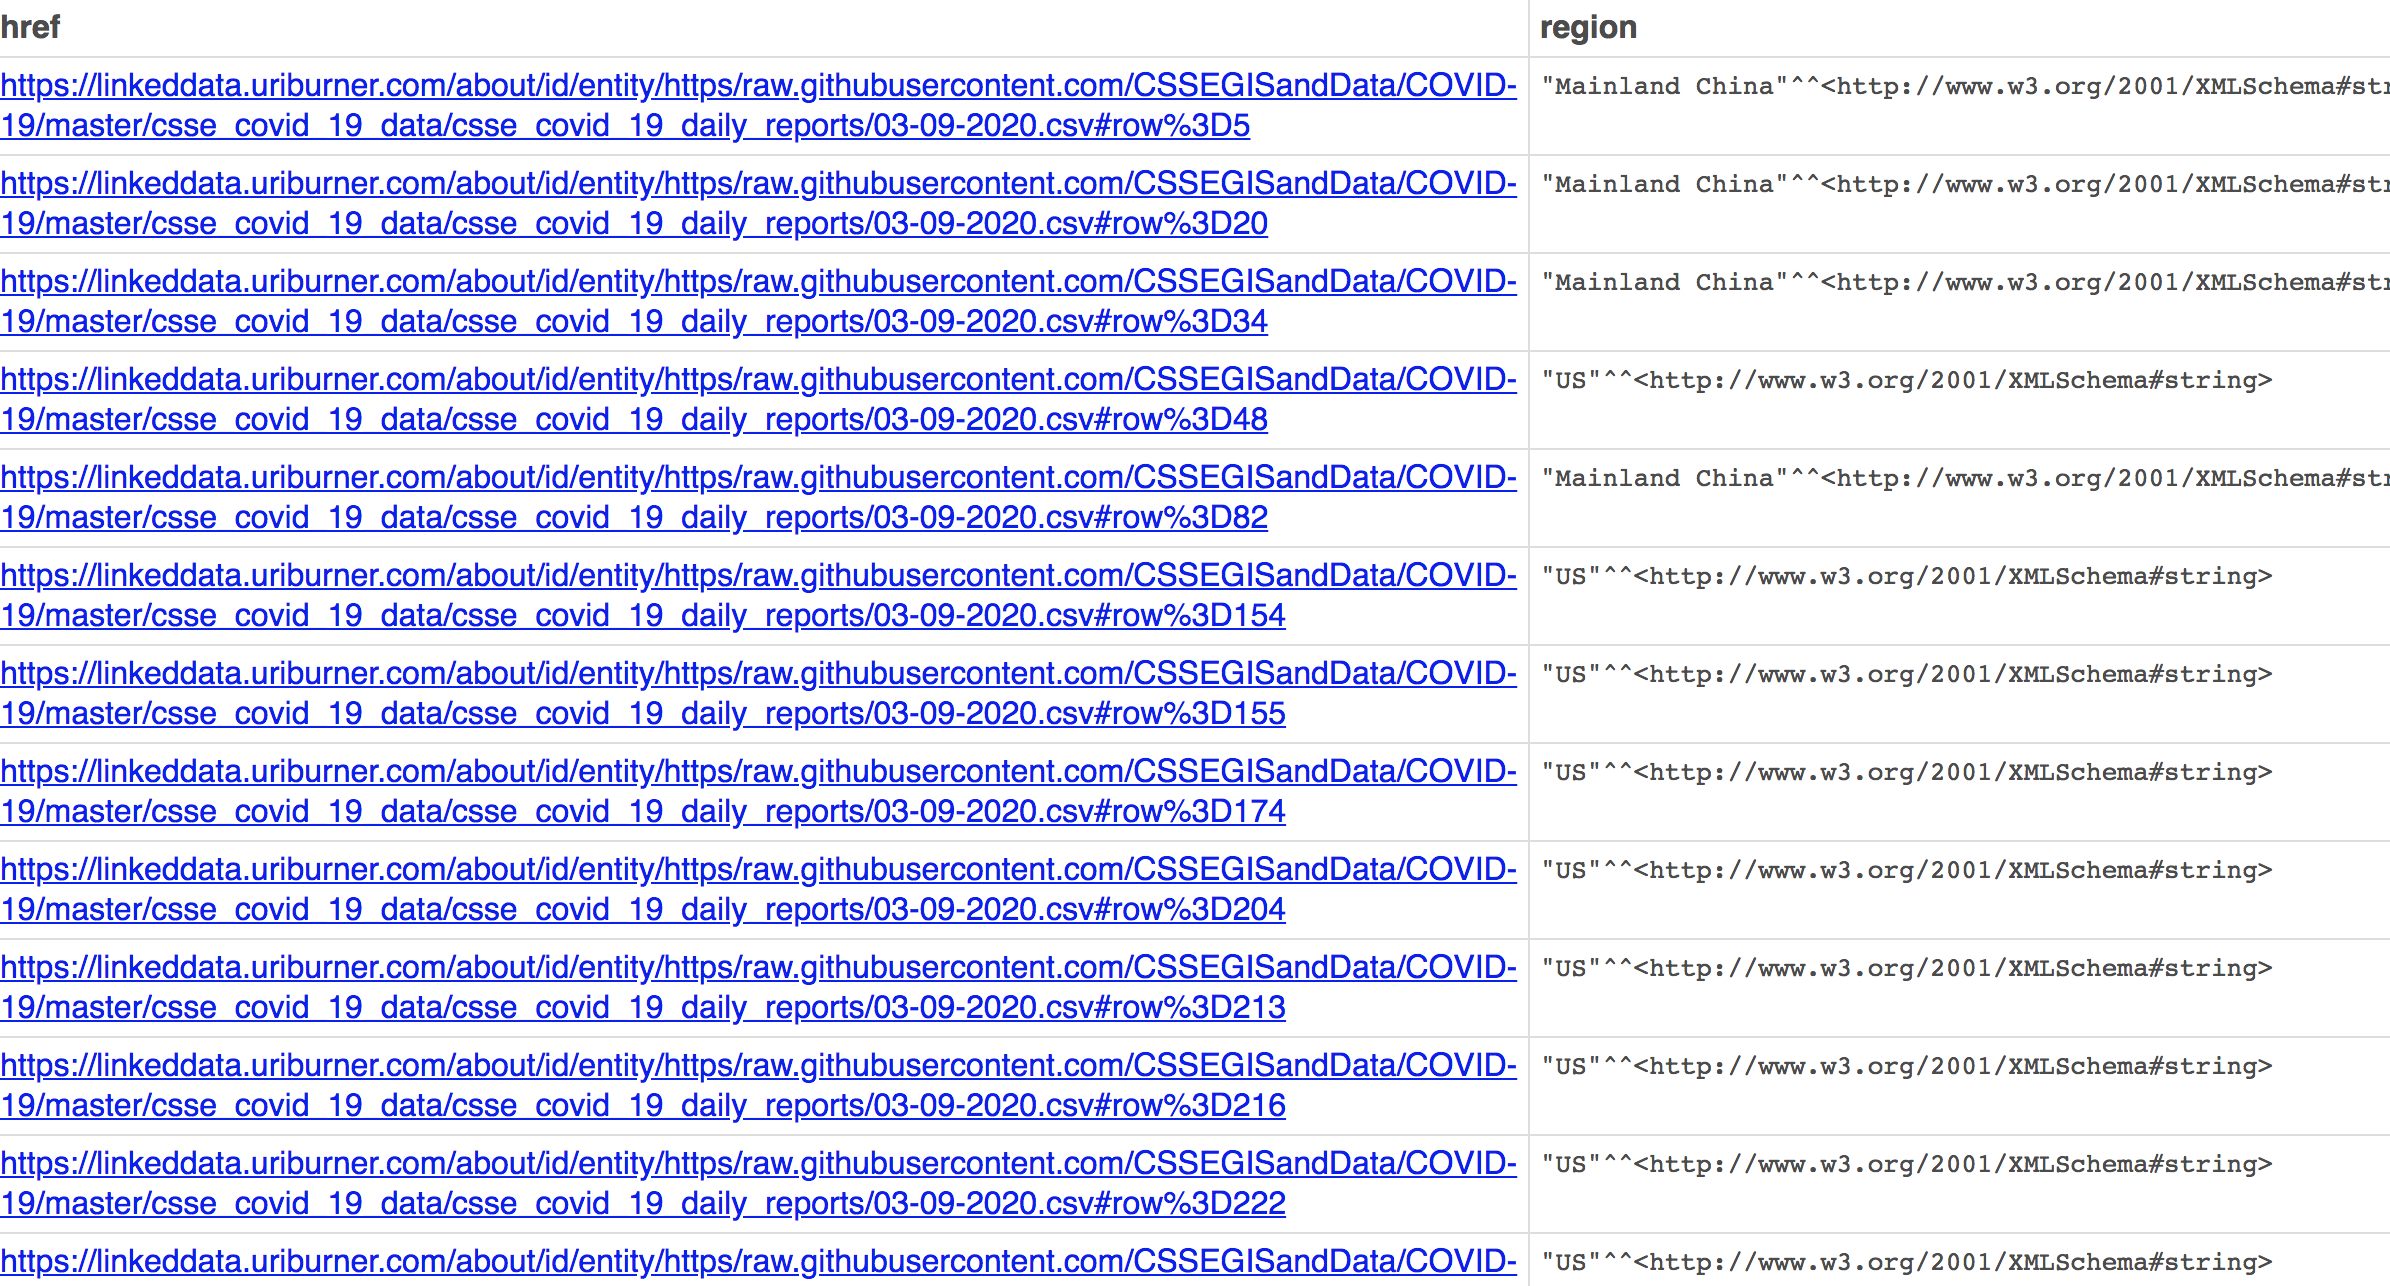
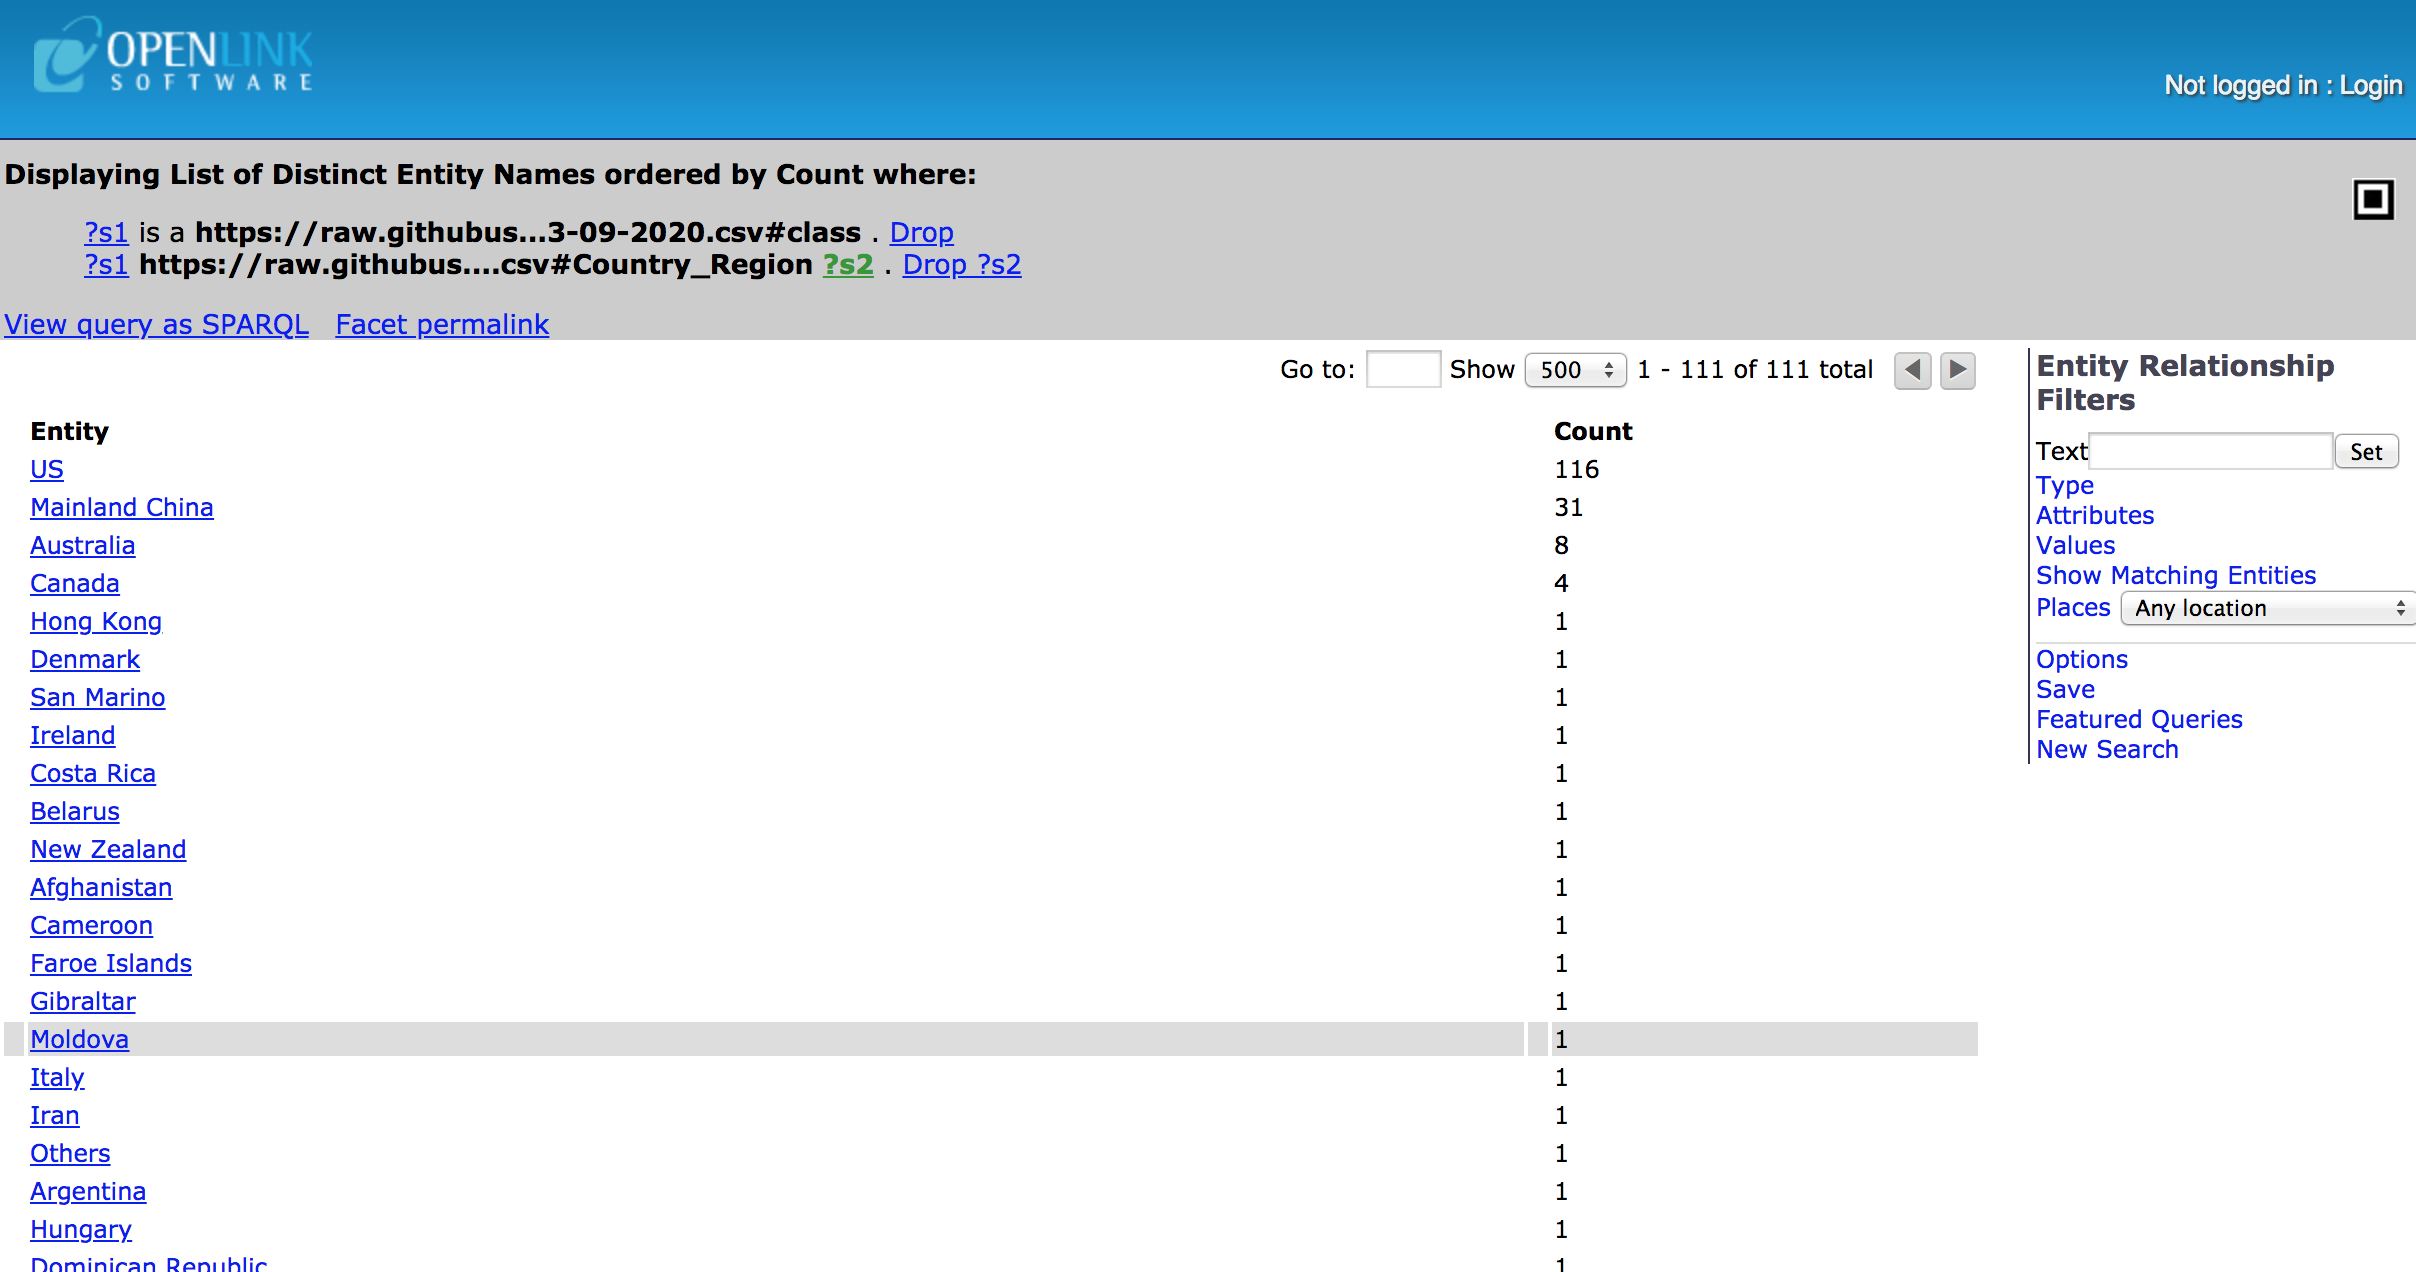
We can then view the data using a Faceted Browsing page informed by an Ontology that was also automatically generated.
Here are some additional views.
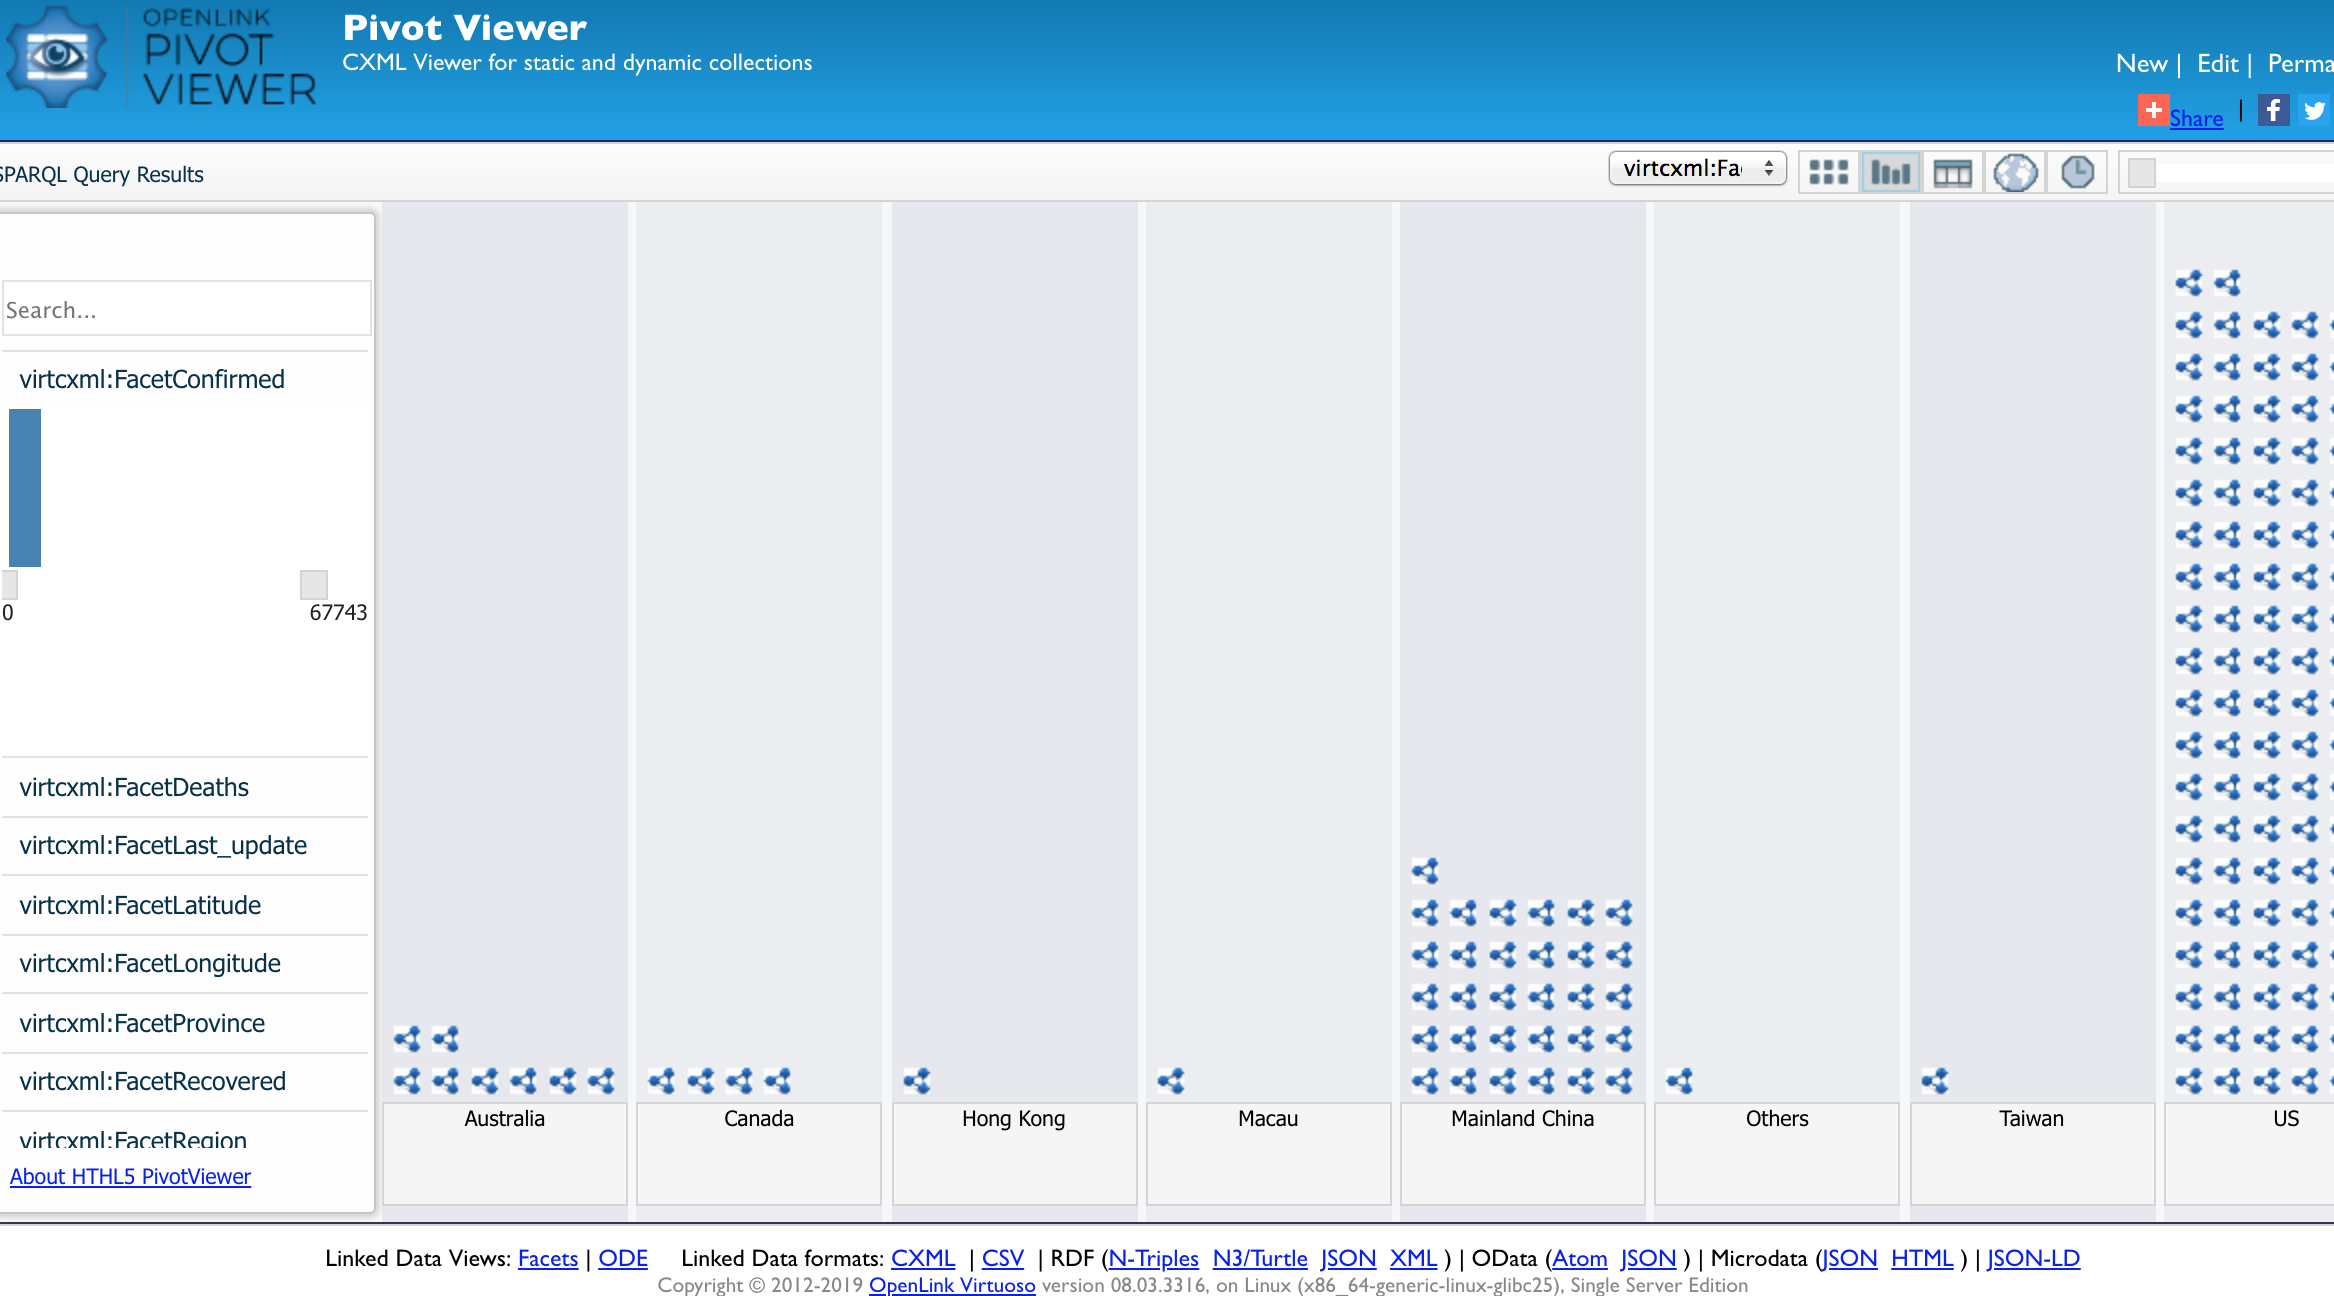
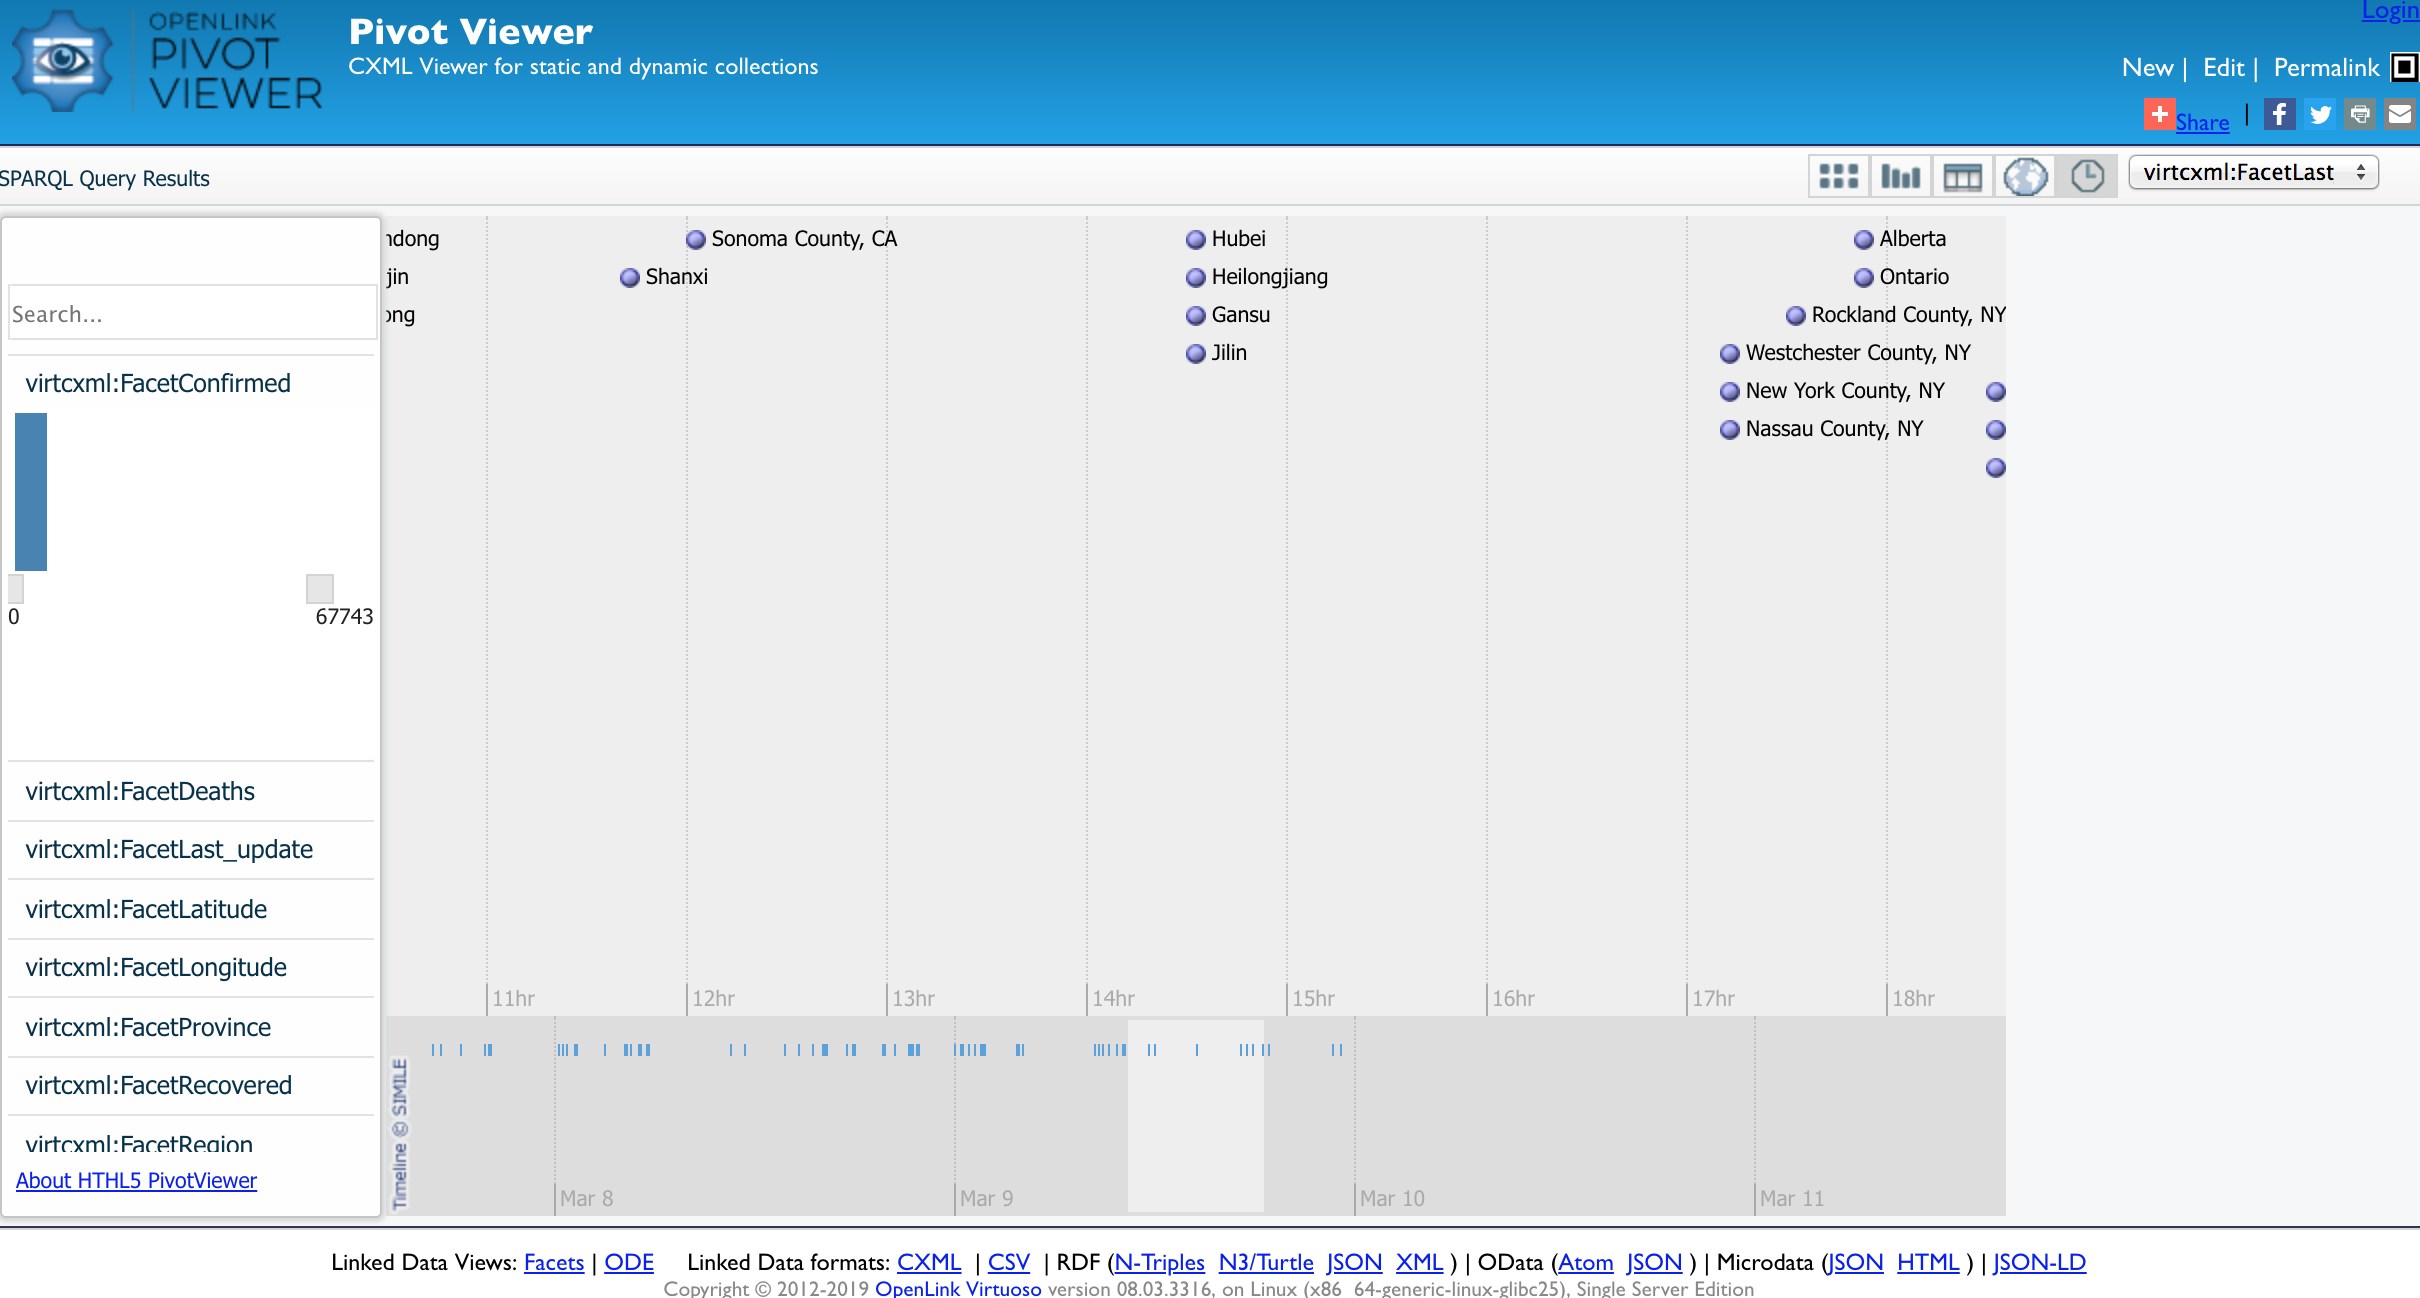
Pivot Viewer Reports for additional Data Visualization