Our data is organized in data sets ranging from 10 items up to 600,000 items in size. We load the data per data set because that’s most convenient for us and because we want to do updates per set later.
The uploading is done using the script I listed in my first post. We first upload a set as http://myorganization.org/dataset/<datasetid_goes_here>_new, then check if there is a data set named http://myorganization.org/dataset/<datasetid_goes_here>. If so we delete that and finally we rename the newly uploaded dataset and remove the _new postfix.
The log lines
14:15:29 Scheduler events are disabled.
14:15:29 PL LOG: Loader started
14:15:41 PL LOG: No more files to load. Loader has finished,
are generated by our loading script. The checkpoint started and finished logs are from our renaming script:
log_enable(2);
UPDATE DB.DBA.RDF_QUAD TABLE OPTION (index RDF_QUAD_GS)
   SET g = iri_to_id ('http://data.europeana.eu/dataset/##DATASET_ID##')
 WHERE g = iri_to_id ('http://data.europeana.eu/dataset/##DATASET_ID##_new', 0);
checkpoint;
log_enable(1);
This certainly isn’t the most efficient way to do our intial loading of all datasets and we probably should introduce separate scripts for the initial loading of all data sets and for updating a set afterwards, but that’s something we want to work on later. Right now my main worry is to understand where the OOM issues come from and try to fix that.
I am starting to wonder if the OOM isn’t simply a logical consequence of configuring so little RAM compared to what you recommend. Our initial tests on a bare metal machine (also with a 8GB limit so we could compare RAM usage) showed memory usage was more stable there. However the test upload I started yesterday on the bare metal server failed after about 11 hours because of OOM. It did load much more though before it was killed compared to our kubernetes deployment, because the bare metal server has more CPU available.
This all gives me the impression that the OOM issue is not directly related to the number of items we load as I thought initially, but to the time Virtuoso spents on bulk loading? Also, as mentioned before, when we complete loading all files after many OOMs and restarts, we are able to run Virtuoso with as little as 4GB RAM.
Anyway, I uploaded the virtuoso.log files of our k8s deployment about 4 minutes before the pod was killed and that of the bare metal server:
virtuoso.log bare metal server up to the point it got killed.
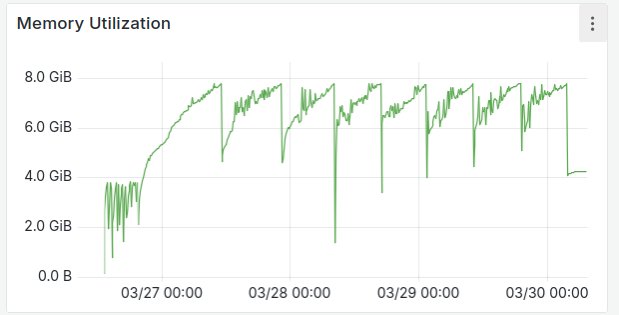
partial virtuoso.log kubernetes while at 7.8GB RAM usage
Here’s also the output of the kubernetes pod’s status(), about 4 minutes before the pod was killed.
OpenLink Virtuoso  Server
Version 07.20.3240-pthreads for Linux as of Nov 11 2024 (ffed4676d)
Started on: 2025-04-01 22:06 GMT+0 (up 09:43)
CPU: 62.71% RSS: 7751MB VSZ: 8847MB PF: 315

Database Status:
  File size 18278776832, 2231296 pages, 520511 free.
  340000 buffers, 319144 used, 9693 dirty 24 wired down, repl age 9297348 0 w. io 0 w/crsr.
  Disk Usage: 2144181 reads avg 0 msec, 0% r 0% w last  0 s, 73838540 writes flush      48.56 MB/s,
    52245 read ahead, batch = 35.  Autocompact 701791 in 559388 out, 20% saved col ac: 31314479 in 6% saved.
Gate:  46707 2nd in reads, 0 gate write waits, 0 in while read 0 busy scrap.
Log = ../database/virtuoso.trx, 185 bytes
1698932 pages have been changed since last backup (in checkpoint state)
Current backup timestamp: 0x0000-0x00-0x00
Last backup date: unknown
Clients: 528 connects, max 2 concurrent
RPC: 8587 calls, 2 pending, 2 max until now, 0 queued, 218 burst reads (2%), 0 second 197M large, 790M max
Checkpoint Remap 2000 pages, 0 mapped back. 6099 s atomic time.
    DB master 2231296 total 519900 free 2000 remap 7 mapped back
   temp  256 total 251 free

Lock Status: 0 deadlocks of which 0 2r1w, 0 waits,
   Currently 6 threads running 0 threads waiting 1 threads in vdb.
Pending:

Client 1111:527:  Account: dba, 207 bytes in, 288 bytes out, 1 stmts.
PID: 716, OS: unix, Application: unknown, IP#: 127.0.0.1
Transaction status: PENDING, 1 threads.
Locks:

Client 1111:528:  Account: dba, 853 bytes in, 543 bytes out, 1 stmts.
PID: 718, OS: unix, Application: unknown, IP#: 127.0.0.1
Transaction status: PENDING, 1 threads.
Locks:


Running Statements:
 Time (msec) Text
        3290 rdf_loader_run()
         420 status()


Hash indexes


44 Rows. -- 451 msec.
I see now that I didn’t properly configure the batch size on the bare metal server and it may have tried to load a very large set in 1 go. Not sure if the bulk loader can handle that or if that could be the cause of the OOM there?